

Key Risk Indicators (KRIs) are essential tools for businesses to measure and monitor potential risks. They act as early warning signals, alerting you to internal and external threats that could derail your organization from achieving its goals. By understanding and tracking KRIs, you can make more informed strategic decisions and proactively mitigate risks.
In complex business environments, risks are inevitable, both internal (like operational snags or project delays) and external (like market shifts or economic downturns).
KRIs help you stay ahead of the curve by focusing on the most significant risks that could prevent you from achieving your objectives.

What are Key Risk Indicators (KRIs)?
Key Risk Indicators are quantifiable metrics that act as early warning signals for potential issues impacting your business objectives. They focus on the likelihood and potential impact of future risk events, allowing you to take proactive measures to mitigate them.
Unlike Key Performance Indicators (KPIs) that track past performance, KRIs look forward. They assess the possibility of a future risk event occurring and the potential consequences.
KRIs should trigger specific actions or responses if they reach pre-defined thresholds. This helps you make informed decisions and take preventive measures to address the rising risk. For maximum effectiveness, KRIs should directly connect to your organization’s strategic goals and risk tolerance.
By implementing a comprehensive KRI system, you can gain valuable insights into potential threats, allowing you to make informed decisions and take necessary actions to safeguard your organization’s success.
What are the metrics used in KRIs?
The specific metrics used in KRIs will vary depending on the nature of the risks being monitored.
Here’s a broader range of examples, categorized by the type of metrics associated:
Quantitative metrics
- Financial: Ratios (debt-to-equity, liquidity ratios), market valuation changes, profit margins, etc.
- Operational: Production efficiency, cycle times, inventory turnover, defect rates, etc.
- Project-related: Performance against milestones, budget variances, etc.
- Customer-specific: Churn rate, satisfaction scores, market share, etc.
- External: Economic indicators, commodity prices, natural disaster incidents, etc.
Qualitative metrics
- Subjective assessments: Expert opinions, stakeholder evaluations, or survey-based ratings on a risk’s likelihood or potential impact
- Categorical: “Low, Medium, High” risk levels, color-coded indicators (green, yellow, red), or other similar classification systems
Hybrid metrics
- Indexes: Combining multiple measures into a single score (e.g., a cybersecurity risk index)
- Time-based: Tracking the frequency or duration of risk-related occurrences (e.g., number of customer complaints per month, downtime of a critical system)

Establishing and Implementing KRIs
As mentioned before, a well-designed Key Risk Indicator (KRI) system serves as your early warning mechanism, identifying potential threats before they derail your goals.
Let us break down the key steps involved in establishing and implementing Key Risk Indicators.
1. Conduct a thorough risk assessment
Begin by comprehensively identifying the most significant risks facing your organization. This might involve workshops, brainstorming sessions, and leveraging existing risk management frameworks.
Prioritize these risks based on their likelihood of occurring and the potential impact they could have on your objectives.
2. Define specific risk events for each KRI
For each high-priority risk, clearly define the specific risk event(s) that your KRI is designed to detect or predict.
Backing your business idea with a solid foundation is the key to success
This could involve outlining specific scenarios or situations that would indicate an increase in risk exposure.
3. Determine measurable criteria
Select appropriate metrics for each KRI. These metrics should be quantifiable or categorizable in a clear and objective manner.
Financial ratios, operational efficiency measures, customer satisfaction scores, and industry benchmarks are some examples.
4. Establish thresholds for action
Define specific thresholds for each KRI. When these thresholds are breached, it signifies a potential escalation in risk, prompting an investigation and potentially triggering mitigation actions.
Setting clear thresholds ensures timely responses and avoids “alert fatigue” from constant notifications.
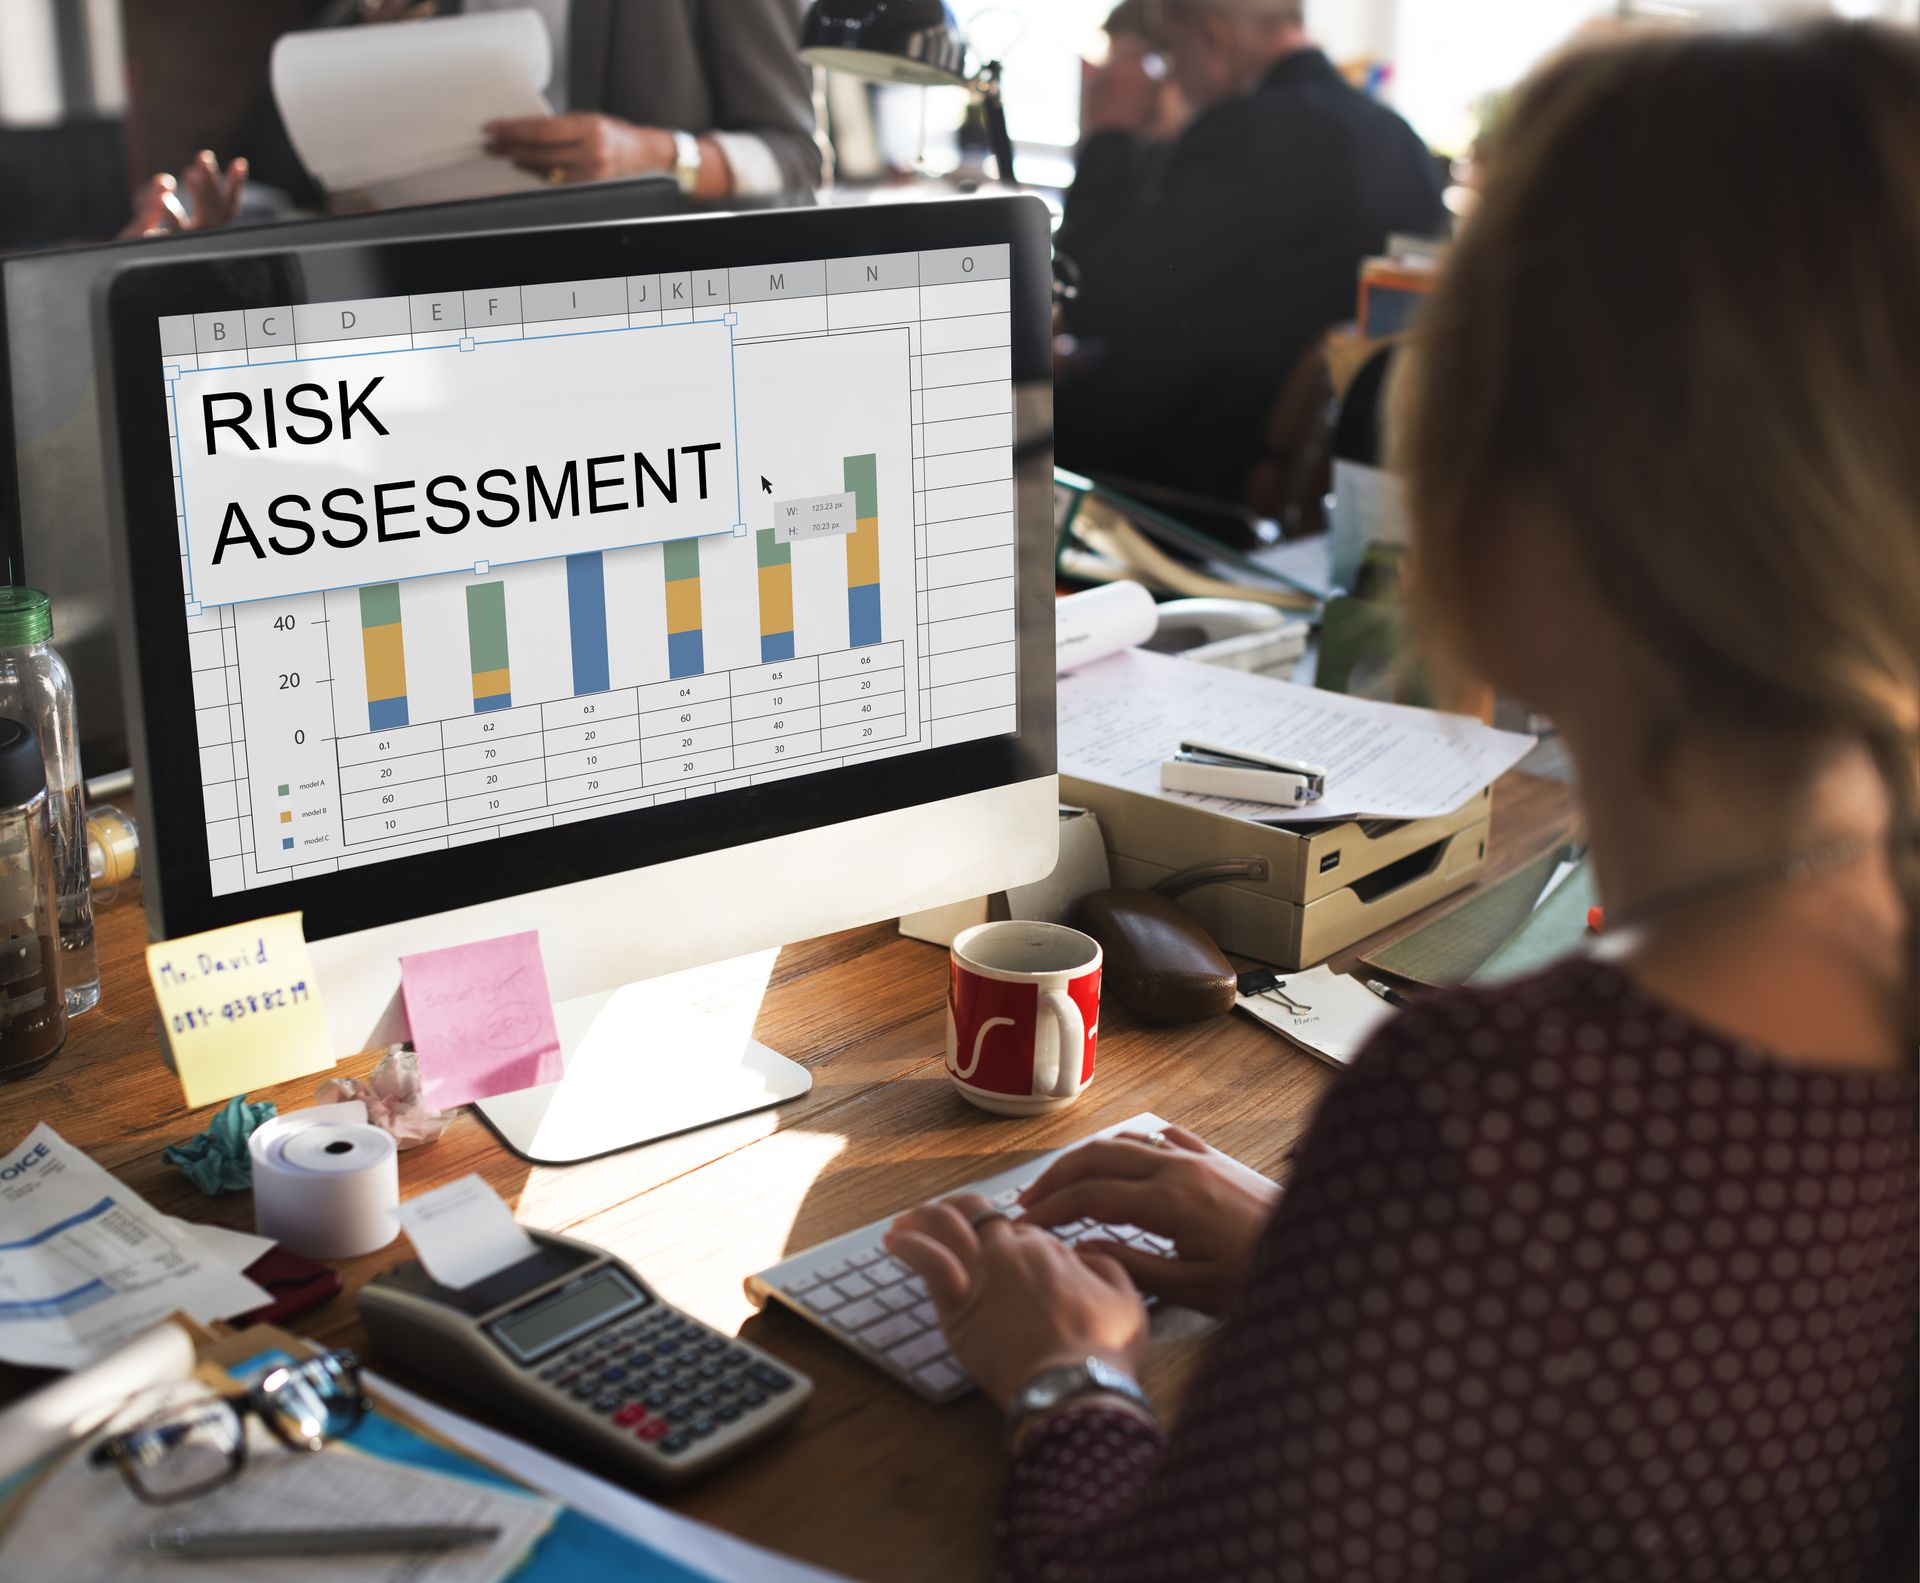
5. Develop a communication and response plan
Establish a clear communication plan outlining who will be responsible for monitoring Key Risk Indicators, how often reports will be generated, and who will receive them.
Develop a response plan that defines actions to be taken when KRI thresholds are breached. This might involve further investigation, implementing pre-defined mitigation strategies, or resource allocation adjustments.
6. Integrate KRIs into existing processes
And the last step is to embed your KRI system into your broader risk management framework.
Regularly monitor KRIs and review their effectiveness. As your business and risk landscape evolve, adapt your Key Risk Indicators accordingly to maintain their relevance.
KRI vs KPI
Key Risk Indicators are essential for proactive risk management. They alert you to changing conditions that could disrupt operations or hinder your business goals.
Key Performance Indicators, on the other hand, are vital for tracking progress, evaluating past performance, and informing strategic decisions for improvement.
Here is a table to summarize the key differences between KRIs and KPIs:
| Feature | KRIs (Key Risk Indicators) | KPIs (Key Performance Indicators) |
| Focus | Potential future risks that could impact objectives | Past and present performance against targets or goals |
| Direction | Forward-looking, predictive | Backward-looking, historical |
| Main purpose | Early warning of risk escalation, enabling proactive mitigation | Measuring achievement and driving improvement towards strategic targets |
| Relationship | Can be leading indicators for KPIs (e.g., rising customer complaints might foreshadow decreasing sales revenue in a future KPI report) | Outcome metrics reflecting the results of actions, decisions, and risks |
| Nature | Focuses on risk likelihood and potential impact | Emphasizes performance outcomes |
Best practice: Organizations should employ a mix of KRIs and KPIs for a holistic view of both risk management and performance measurement. Key Risk Indicators and Key Performance Indicators can be interrelated, with KRIs providing an early indication of potential future problems that might later be seen in declining KPIs.
Business is always dynamic and you never know when potential risks will find you. But with these metrics and practices, you will always be ready, no matter what challenging winds blow.
Featured image credit: Freepik.