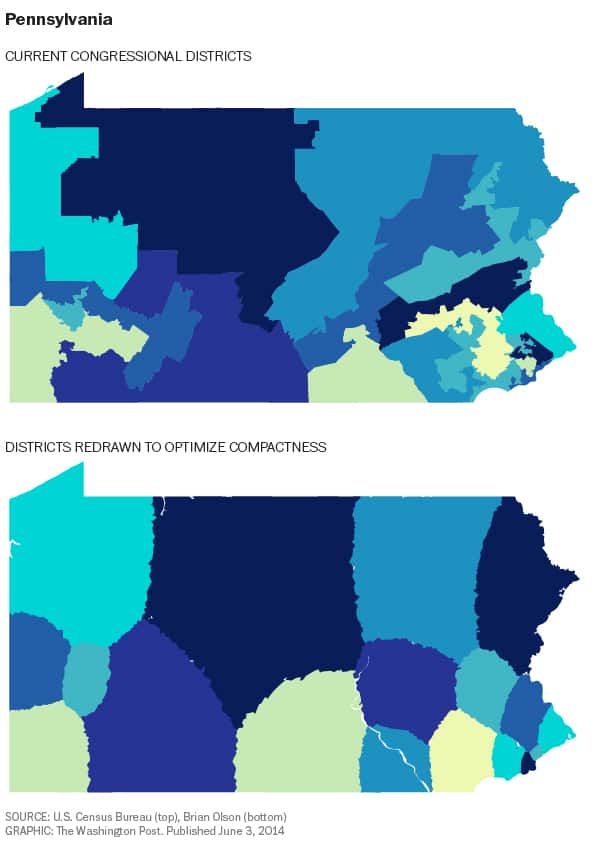
Gerrymandering in the US is a serious issue. The Washington Post estimates that as a result of gerrymandering, the Democrats under-represented by about 18 seats in the House, relative to their vote share in the 2012 election. Brian Olson, a software engineer from Massachusetts, has devised a programme which works out the most “optimally compact” districts based on 2010 census data, and avoids the need for human, politically-biased involvement in the drawing of district lines.
Brian Olson describes his methodology:
It looks at the boundaries between districts and tries to make things better by flipping one block from district A to district B (and possibly over some number of steps, other blocks from B to C and C to A). It doesn’t actually directly optimize the measure of population compactness, but looks at related measures like the ratio of the block’s distance to the average edge blocks’ distances from each district’s center, and the ratio of the populations of the two districts the block might go into. Each district grabs up to one block, then centers are recalculated and the cycle begins again checking all the edge blocks.
In practice, compare the current congressional district map of Pennsylvania to the redrawn, optimised districts below:
Of course, the idea is not without its drawbacks. Some argue compactness is not the best measure of quality districts, and they should instead be drawn in respect of “communities of interest”, allowing for some kind common denominator among the voters in a given district. But what this common denominator could be almost anything- shared cultural background, economic interest, ethnic background, demographic similarity, political boundaries, geographic boundaries… The list goes on. Such a loose definition of what actually constitutes a “common interest” opens the door to some seriously creative interpretation by politicians looking to give their party the edge.
Another issue is the fact that the Voting Rights Acts stipulates the drawing of some majority-minority districts, which isn’t covered in Olson’s model. But, by concentrating minorities in one or two districts, it diminishes their impact in all of the others, in effect partially disenfranchising them. Once again, a politician could use this to concentrate a minority group who didn’t favour his party into one or two districts, if he was so inclined.
Communities of interest and minorities are important factors, which should not be ruled out. But whilst there is human involvement in the drawing of district lines, there is room for political bias. An entirely computer-based model is certainly food for thought.
Read more here.
Follow @DataconomyMedia
Interested in more content like this? Sign up to our newsletter, and you wont miss a thing!
[mc4wp_form]


