This week, the STORM team arrived in China – after passing 13 countries and 12 borders, and after a long, long wait at the border to receive Chinese driver licenses. Now there will be 16 days spent in this one country. In this post we’ll find out something more about the countries the team has visited thus far and how the environment influences the motorcycle.
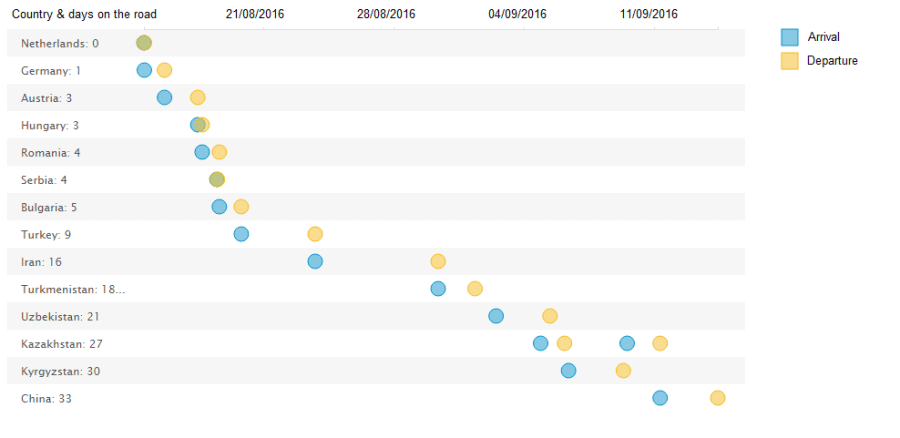
How many and which countries were passed before entering China? See the below graph to see which ones and how many days were spent per country. Kazakhstan is the only country that was visited twice (due to the funeral of the president of Uzbekistan, which resulted in cancellation of some events there, being replaced by a visit to Kazakhstan instead).

Can we do more analytics on country level? We dug deeper into some website-analytics to do some analysis on visits to the app follow.storm-eindhoven.com.
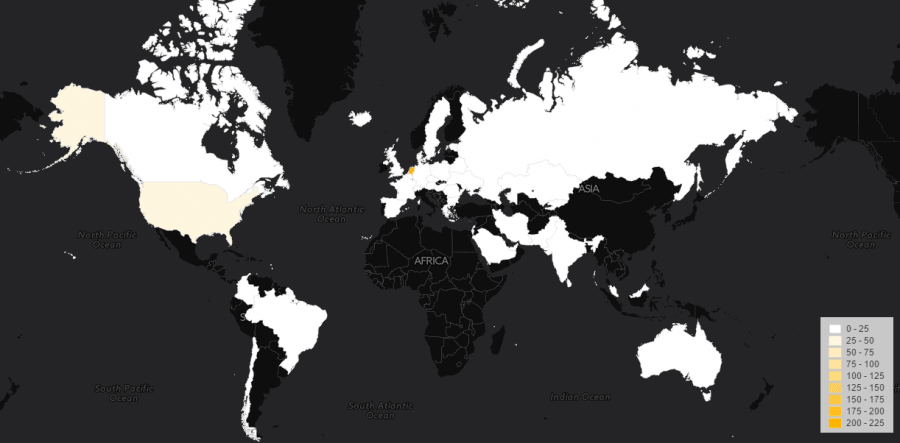
The first visualization is to map out where visitors are coming from. As you can see, quite some countries are covered… It’s nice to see that the word about the STORM motorcycle seems to travel faster than the motorcycle itself. In the graph below you can see which countries visited the STORM website so far – as you can see people are following from all over the world.

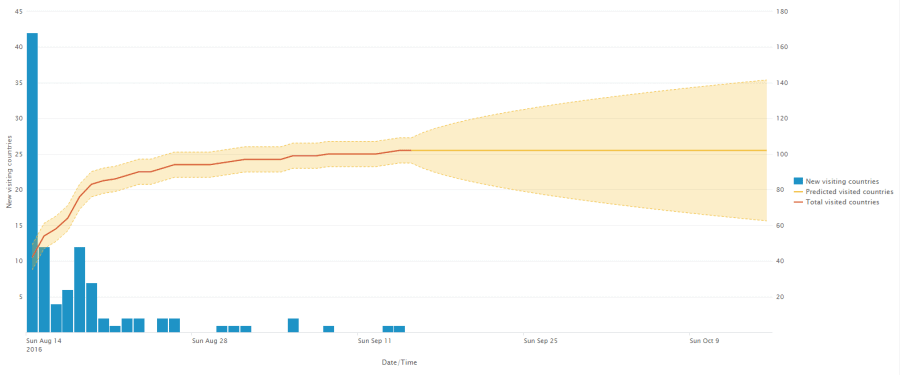
Looking one level deeper into unique countries that are added to the map on a daily basis, we see that at the departure day of the tour a high number of 42 unique countries were visited the site in one day. Later during the tour, this was lowering down to a few new countries added per day.
If you sum up all countries that have been looking at the site, the number up to 14 September is: 102. This means that up to now, 53% of all countries have been following STORM. (Based on total country number that most of the current experts and international authorities agree upon – 194 countries in existence. However, different international bodies differ greatly on how many countries there are. The 194 countries do not include Kosovo, or Palestine or Western Sahara or Taiwan or Greenland or many other partly recognized states.)
Will we reach all countries by the end of the tour? Of course the list of countries that haven’t visited the site is shrinking so we don’t expect the rate to go up very much, which is clearly visible in the prediction line.

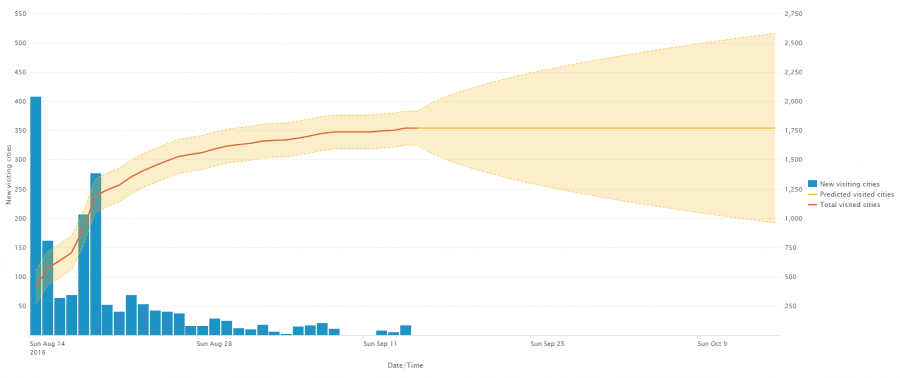
The number of unique cities is the next zoom level – How many cities are there in the world? The Getty Thesaurus of Geographic names has 248,752 inhabited places (cities, towns, etc.) listed in its database (source: http://www.getty.edu/vow/TGNServlet?english=Y&find=&place=inhabited+place&page=1&nation=).And The GeoLite database of MaxMind contains about 377k inhabited places (cities, towns, etc.) in the whole world.
So let’s average those two numbers to 313K. The STORM website has been visited from over 1.700 different cities in the world, so no world domination yet – but getting close. STORM is really reaching people with a message of electric mobility.

What can we analyze from the bike-data that is transmitted in real-time to our Itility Analytics Platform? By only knowing the outside temperature and how fast you are driving, it’s possible to calculate a temperature estimate of the STORM bike’s internal components. The graph shows our estimate and the actual temperature. By increasing the accuracy of the model we might be able to predict potentially harmful conditions for the motorcycle or do preventive maintenance based on the predicted weather conditions.

But – not only outside temperature has an effect on the motor temperature. This graph shows that also the UV-index (amount of sunshine) has a role. Example: although the outside temperature is lower in situation 2 compared to situation 1, the motor temperature is nearly equal.

If there is anything you’re wondering about the STORM motorcycle, let us know! We’ll try to find the answers in the data. Check out storm.itility.us or follow.storm-eindhoven.com and we’ll keep you posted.
Like this article? Subscribe to our weekly newsletter to never miss out!


