So far in the “Understanding Big Data” series, we’ve looked at what “big data” actually means; what the big data landscape looks like; and some of the infrastructural approaches you might look into when you’re taking the first tentative steps away from the data warehouse. In this edition, we’ll be examining different analytics platforms- how they work, what opportunities they offer enterprises, and how they differentiate themselves from their competitors.
Around the turn of the millennium, most enterprises had turned to modern business applications to offer them insights. Companies had been implementing CRM and ERP systems to capture data, and the rise of parallel processing techniques made data storage and processing cheaper and quicker than ever before. But garnering this data was not, in itself, helpful- this data had to be analysed to be of any value. That’s where analytics platforms come in.
Analytics Platforms
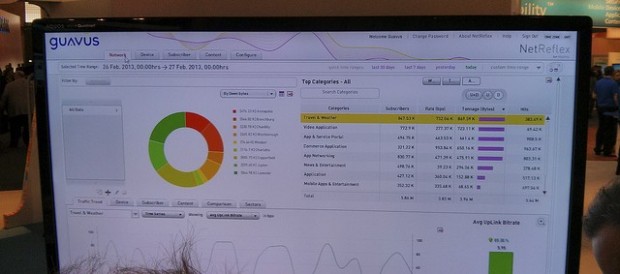
 Guavus; source
At their core, analytics platforms harness the data and transform it into something comprehensible for the end user. They transform the data into reports and analytics dashboards which companies can use to fuel decisions and optimise their services. The most powerful tools in this field pull in multi-structured data from multiple sources and delivers actionable insights in real time. Some big names in this field include:
- Guavus- Guavus provide an end-to-end view across operations in real time. Guavus is capable of processing over 2.5 petabytes of data a day- that’s equivalent to 250 billion records a day, or 2.5 million records a second.
- Datameer- Datameer markets itself as the only end-to-end big data analytics application purpose-built for Hadoop. Datameer takes your multivarious data spread across the cloud, legacy databases and spreadsheets and helps you to integrate it all into Hadoop. It also allows you the option to choose whether you want a one-time input or continuous integration as new data comes in. You can then analyse and visualise your data from a single source.
Business Intelligence Platforms
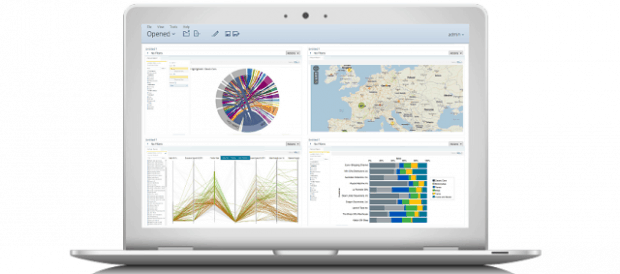
Pentaho; source
In 1958, IBM researcher Hans Peter Luhn employed the Webster’s dictionary definition of intelligence to discuss Business Intelligence: “the ability to apprehend the interrelationships of presented facts in such a way as to guide action towards a desired goal”. The same holds true for Business Intelligence tools today; presenting the interrelationships between data in such a way that it illuminates decision-making and pushes enterprises forward. Companies developing tools within this field include:
- Jaspersoft- Computer Weekly described Jaspersoft as “business intelligence on the cheap”- whilst this might not sound like the most favourable review, Jaspersoft’s open source offerings have proved extremely popular. As well as open-source, Jaspersoft provide commercial products, support and service. Some of their unique features include mobile compability, integration with Google, MongoDB, Cassandra and Hadoop, and cloud BI for less than a dollar an hour.
- Pentaho- The Pentaho model also offers a community and enterprise offerings. Jaspersoft’s and Pentaho’s models are fairly similiar, but Jaspersoft is said to be stronger in terms of reports and community support, and Pentaho is more adept at OLAP analysis and dashboards.
- Birst- In our interview with Southard Jones, Birst’s VP of Product Strategy, he defined his product like this: “The key to Birst is the ability of our product to automate the hardest part of BI – which is all of the raw, ugly, un cleansed data that is all over your organisation and is multiplying at insane rates )[…] In essence, we create a business library that appeals to the way a business person thinks about their business.” One of their most recent innovations was introducing support for SAP HANA.
- SiSense- SiSense markets itself as the database which allows “non-techies” to “skip the data preparation nightmare” by combining data sources into a single repository. It allows users to drag-and-drop data from sources such as Excel, Google AdWords and Analytics and CRM information, and move quickly and painlessly to analytics and visualisation.
Visualisations
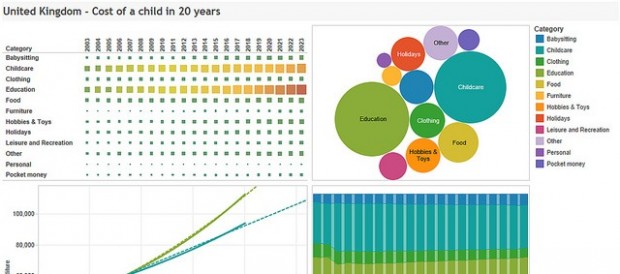
Tableau: source
Visualisation involves taking the raw data and presenting it in complex, multi-dimensional visual formats to illuminate the information. Although many analytics programmes offer visualisation as part of their product, some companies primarily focused on visualisation include:
- Tableau- As easy-to-use tool which allows you to drag and drop elements to create visualisations on the fly, and is accessible for users of all skill levels. It also promises speeds up to 10 times faster than those of traditional Business Intelligence tools. They also have a Cloud version, and can scale from small companies to enterprises with tens of thousands of employees, who can all use and modify the visualisations.
- Visual.ly- Visual.ly is a community platform for data visualisation and graphics. As well as a gallery of user-designed infographics, their in-house design team build a range of ad-hoc infographics, including analytics.
There are a dazzling range of analytics solutions out there, from free offerings capable of giving basic analytics in real time to programmes that can produce complex visualisations of immense datasets. In the next installment of “Understanding Big Data”, we’ll be looking at Machine Learning- moving from understanding patterns in the data you have to predicting trends you may encounter in the future.
(Image credit: Birst)
Eileen McNulty-Holmes – Editor
Eileen has five years’ experience in journalism and editing for a range of online publications. She has a degree in English Literature from the University of Exeter, and is particularly interested in big data’s application in humanities. She is a native of Shropshire, United Kingdom.
Email: [email protected]
Interested in more content like this? Sign up to our newsletter, and you wont miss a thing!
[mc4wp_form]


Totally disagree that jasper has a better community. They have no usergroups and pentaho have loads. There is even a pentaho meetup tonight.
the only people who say jasper community is better are jasper. Marketing gumph basically
Excellent insight