For those of you similarly interested (obsessed?) with the changing role of government statistics relative to the explosion of highly dimensional private sector data, I recommend having a look at Innovations in Federal Statistics: Combining Data Sources While Protecting Privacy from the National Academy of Sciences. It’s an easy read and offers a solid foundation for those who seek a better understanding of governmental statistics.

This is the first of two volumes. It addresses the current state of government statistical creation, including legal frameworks, approaches to foster transparency while protecting privacy, current issues in social science survey design and the role of private data. A forthcoming second report will investigate the envisioned use of public and private data sources in an a new paradigm.
Government stats are crucial but are often taken for granted, deemed sacrosanct and are sort of inevitable. Unfortunately the reality is different– shrinking budgets, the rise of private sector data, declining response rates, lags between close of period and reporting, madman episodes (Jack Welch accusing the Bureau of Labor statistics of fudging the numbers or Trump calling unemployment rates “fiction“) and an arguably broken (or breaking) approach to government stats should matter to all. Hundreds of billions of federal budget dollars, state allocations and private sector investment/trading decisions all rely on official stats.
Your author feels there are there are three core problems with the federal statistical program and these problems are tied to systemic governmental issues. These issues are decreasing response rates/increased costs of enumeration, processing and distribution, availability of additional sources and timeliness in reporting.
Decreasing Response Rates/Increased Costs
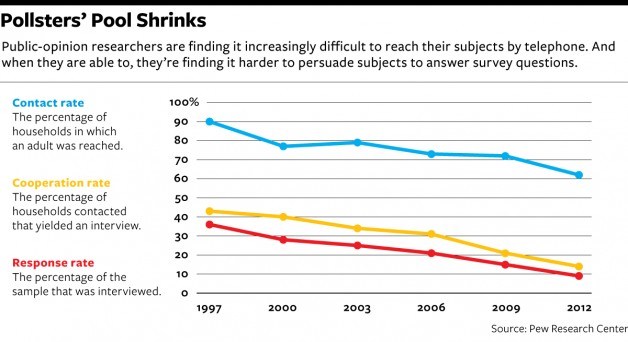
Survey rates of been in decline for about 20 years and about one half of US households have a fixed-line telephone. Contacting mobile phones and emerging survey techniques are part of the answer, but the implications of survey design have second-order impacts–there are disproportionate impacts on income, race, age, education and other demographics that can skew survey results and introduce unintended bias from non-response. For example, the National Crime Victimization Survey has found that the “…demographic group with the lowest response rates is the group with the highest victimization rates.” To overcome this, statistical imputation is used, furthering the bias from non-response. This challenge is also evident for smaller geographic regions. The impacts to any kind of broad-based survey research are obvious.

Some of these issues are not especially new–technology has always been used, but in more of a ‘catch up’ than ‘remain ahead’ way. Statistical sampling was introduced in 1940, which allowed some surveys to be released eight months faster. UNIVAC was introduced in 1951, bringing real computational power decreasing error rates to survey processing. However, the role of technology cannot be considered every 30 years.
Availability of More/Better Data
The seemingly obvious response to this is issue is to attack administrative gridlock, but the challenges are enormous. Incorporation of private data might even be easier than reforming the beast that we have, and this is largely due to inter- and intra-agency agreements, a history of broad decentralization, stone-age technology and processes coupled with few clear mandates. The Office of Management and Budget is charged with coordinating federal statistics. There are 13 principal statistical agencies and 125 agencies that generate stats. It’s a real multi-headed beast crippled by lack of broad coordination despite many governmental panels and commissions charged with reforming the approach to statistics.
A key opportunity is for government to use what it already has. Administrative data (data collected by government entities for program administration, regulatory, or law enforcement purpose) represents a rich pool of data from state unemployment programs, tax forms, Social Security benefits, Medicaid, food stamps, etc… The opportunities are vast, but few governmental incentives exist to change behavior. Initiatives exist, but they are few and far between. Contrast this with the experience in European countries where it is estimated 80% of data comes from administrative sources and 20% from surveys. A former director of the US Census Bureau suggested this ratio is reversed in the US.
I’m not going to address the use of private data here (that is a book on its own!), but it is an area of active research in government and the academic community. I’d summarize the challenges from the report. That said, outside of government statistical work where transparency, robustness and credibility are crucial, industry (led by hedge funds) have been trailblazing new sources using novel analytical techniques to create proxy indicators.
“…the new data resources arise not from the design of a statistician, but as part of other processes. Sometimes the processes generating the data produce information that may be relevant to of cial statistics, but this is not their primary purpose. Hence, although the data have been collected by these enterprises, they are not, for the most part, immediately usable for statistical purposes or analysis.”
Timeliness
The private sector will continue to exploit arbitrage opportunities with macro trading strategies as government stats are typically released 30 to 90 days after close of period. That likely isn’t a big motivator for government to change, but it may unintentionally wean industry to proxy statistics, which, while not as reliable, are timely. ADP, a payroll provider for roughly 20% of the US non-government workforce, has computed its own unemployment reports over the past ten years. Private actors offering now-casting services or near-time updates to EU unemployment rates using Google search behavior.
When government releases stats, in some cases you have to hold your breath:
“The Bureau of Economic Analysis (BEA) publishes three estimates for the US gross domestic product (GDP) for each quarter, with the “initial” estimate released 30 days after the end of each quarter to provide as timely information as possible. The following month a “second” estimate is released: it includes more complete data than was available the previous month. The next month, the “third” estimate for the quarter is released, based on the most complete data.”
Unless/until we have wholesale reform and centralization across all statistical programs in the US, government might start thinking that industry can do better and at lower cost. The challenge here is that those with vested interests tend to be blind to the needs of those with other interests.
The genesis for this work product was a workshop entitled “The Panel on Improving Federal Statistics for Policy and Social Science Research Using Multiple Data Sources and State-of-the-Art Estimation Methods.” Thank god this didn’t get converted into an acronym!


