The last stage of the STORM 80-day tour will be driven on November 2 – from Paris to Eindhoven, accompanied by many electrical vehicles.
Hacking at ITility
In the meantime, we used the results from the hackathon at Stanford University, to dig deeper into that same data set during the second Hackathon at our Itility office in the Netherlands.
What was the hackathon about? 2 main topics: Digging into the electrical spike patterns; and digging into the environmental influencers of driving behavior.
Quick recap of the data used: 28 days of data from the bike – 150 million events, which could be anything from a battery error or a temperature measurement, to the left blinker being turned on.
The data came from 3 main sources:
- The battery management system (BMS), containing a lot of detailed data from the bike’s complex battery system
- The body controller (BC), containing all sorts of data from the controls of the bike (from horn to cruise-control)
- The built-in 3G/GPS module, which sends real-time GPS coordinates and speed of the bike.
Results
After 3 hours of digging into the data, each team was called forward to give a 2-minute pitch on their findings.
The first group (Kevin and Sateh) visualized the patterns of the body temperature. They started with a scatter plot where module temperature is plotted against speed (divided in classes of 10 km/h).

Next, they used anomaly detection to dig further in the data, and found two spikes in BMS master temperature in cartridge 5. Digging further into this cartridge, they found the errors in the logging that occurred just prior to the temperature spikes. The next step is to use the events happening just before the error appeared to build a model to predict this temperature-error to happen.

Next group (Donald and Arati and Mike) dove deep into one specific day of data (September 7), and looked at the standard deviation of the module temperature, which turns out to be quite low. Also, they noticed that chip 1 showed many errors. Next step is to dig into the root cause of the errors.
They also found that speed was correlated to the heading of the motor: the motor is on average driving faster when going east, and more slowly when driving west, as you can see in the graph below.

It may have to do with the fact that the most of the time the motorbike is driving east (which is often on a highway), and going west is only happens in small time-windows (probably not highways).
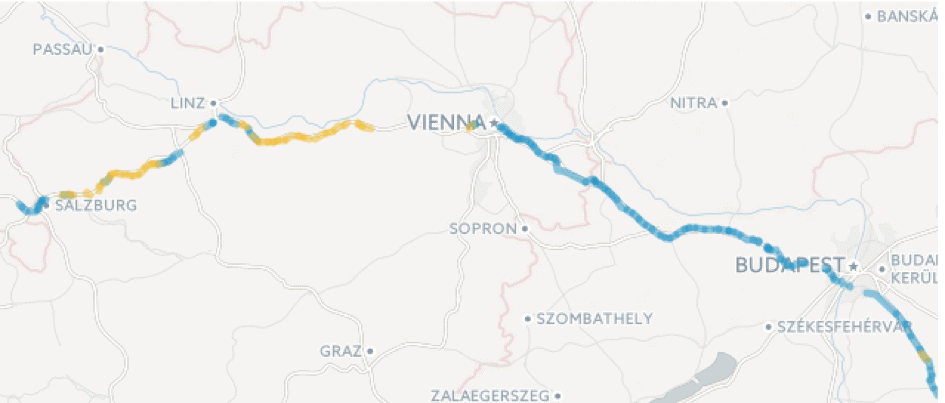
Lastly, they investigated whether the bike was driving above the Dutch speed limit of 120 km/h and plotted the results on a world map (yellow color means driving more than 120 km/h). Apparently, in Austria a lot of speeding tickets could have been given to the STORM team if a Dutch police officer would be on duty there.
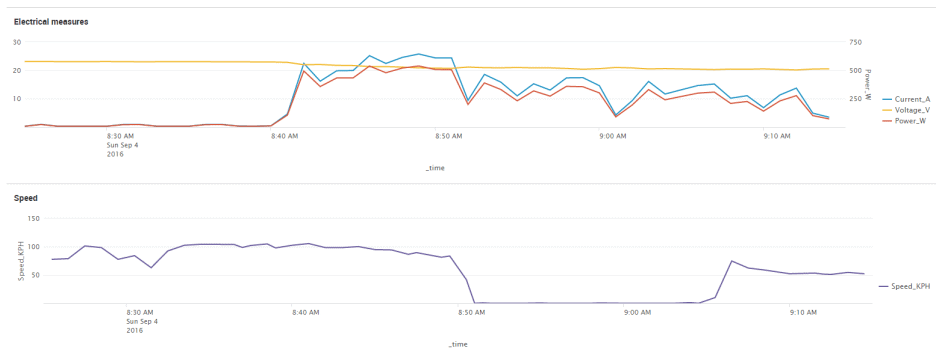
Group 3 (Dannes and Cristin and Sander) checked out the bike specifications. Based on these specs they defined which actions would fall under “dangerous violation of the specs”. They actually found examples in the data of these dangerous violations – and digging further in the data they saw that after such a violation occurred, the motor stopped moving.
See the graph: the power (Watt) is calculated by multiplying the current (Ampere) with the voltage (Volt). The voltage slowly decreases over time, causing the power to follow the graph of the current.
Using the specifications of the battery, it could be concluded that the power of the battery was too high just before 8:50 AM. If the stop at that time was a stop due to technical malfunction, this could be the root cause.

Last group (Tim and Robert and Mark) used both Splunk and PowerBI to visualize various parts of the trip. Some detailed research resulted in the visualization of the measured voltage of the module. For example, the decrease in voltage per cartridge and when a cartridge was replaced. The figure shows several steep upwards slopes which indicate a replacement of the cartridge. This indicates an average voltage range between 20 and 25 Volt. Next step would be to correlate the decrease of the voltage to other factors during a specific time period, such as speed, weather and type of environment where the bike is driving.

A metadata analysis was combined to these findings which visualizes the maximum speed and module temperature per day. A hypotheses was that the maximum speed and module temperature would be related during the trip.

Follow the STORM bike live on November 2! If you own an electric vehicle, please join the team in their last kilometers towards Eindhoven: https://youtu.be/wg5spx_UZKo
Like this article? Subscribe to our weekly newsletter to never miss out!


