This is the first instalment of our series with Itility. We will cover the journey of the STORM Wave, the world’s first electric touring motorcycle, as it goes around the world in 80 days. The Eindhoven University of Technology team will complete the 23,000 km tour using only the world’s existing electricity grid.
A groundbreaking tour started on August 14: Driving around the world in 80 days on the world’s first electrical touring motorcycle, the STORM Wave, designed and built by 23 students of the Eindhoven University of Technology (TU/e).
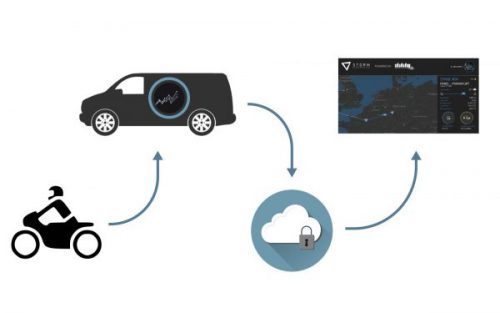
The motorcycle and its engine generate some very useful data, which is sent from sensors in the motor via 3G to the support-van and into a cloud analytics solution.

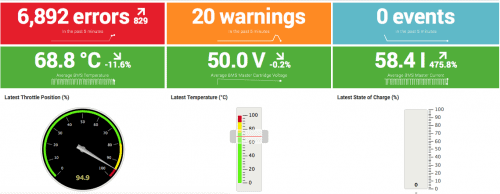
All data is collected, saved and analyzed via a dashboard that can be followed real-time by the engineers in one of the support cars which give them direct insight into the “health” of the motorcycle. This action-focused dashboard filters the many messages that the sensors in the motor send, to help focus on the real errors which require direct action.
The engineer-dashboard does not use advanced analytics techniques – but helps the engineers via a visualization of all message-values (grouping them into “reds”, “oranges” and “blues”). Clicking the groups brings you to the details of all messages. In addition, it visualizes KPI’s such as temperature and cartridge voltage. For this we are using business rules to define if the value is “green” (OK), “orange” (warning) or “red” (big error, stop immediately). Plus, it visualizes the current value, the up- or down-trend and a spark line with values over time.
All of this will result in a higher safety and the possibility for preventive maintenance, fine-tuning and optimization.

Analytics powered by IMAP
The data is also sent to a cloud platform: the Itility Managed Analytics Platform (IMAP). This enables to perform more advanced analytics, such as self-learning algorithms to predict the travel time based on different factors, such as weather conditions, driver and battery level.
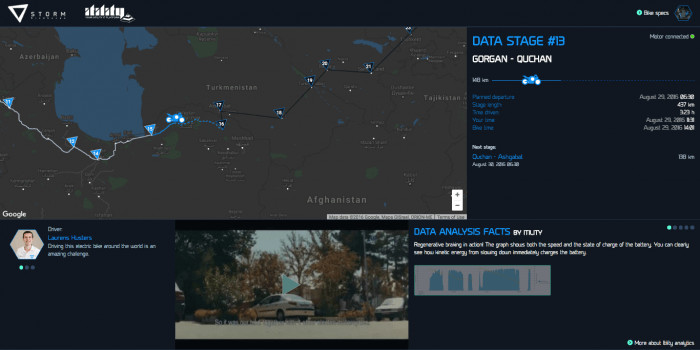
That same cloud analytics platform generates another dashboard. This view allows you to follow the STORM World Tour real time, via an app – you can see where bike is driving, who is driving, and how many hours/kilometers remain. In addition, the app shows tweets posted with #Storm80Days, and a handful of daily updated ‘data analysis facts’.

For now, since there are only a few days of data collected, those data facts consist of quite basic facts such as “which countries are following the bike via the app?”, and “how many tweets are sent per hour/per day?”.
As the bike makes its way through the 80 day tour and more data is collected, the facts will become more sophisticated. In upcoming posts we will talk about those data analytics facts in more detail.
Follow the STORM team during their tour around the world in 80 days: storm.itility.us or follow.storm-eindhoven.com
Like this article? Subscribe to our weekly newsletter to never miss out!


