Dataconomy
  • News
    • Artificial Intelligence
    • Cybersecurity
    • DeFi & Blockchain
    • Finance
    • Gaming
    • Startups
    • Tech
  • Industry
  • Research
  • Resources
    • Articles
    • Guides
    • Case Studies
    • Glossary
    • Whitepapers
  • Newsletter
  • + More
    • Conversations
    • Events
    • About
      • About
      • Contact
      • Imprint
      • Legal & Privacy
      • Partner With Us
Subscribe
No Result
View All Result
  • AI
  • Tech
  • Cybersecurity
  • Finance
  • DeFi & Blockchain
  • Startups
  • Gaming
Dataconomy
  • News
    • Artificial Intelligence
    • Cybersecurity
    • DeFi & Blockchain
    • Finance
    • Gaming
    • Startups
    • Tech
  • Industry
  • Research
  • Resources
    • Articles
    • Guides
    • Case Studies
    • Glossary
    • Whitepapers
  • Newsletter
  • + More
    • Conversations
    • Events
    • About
      • About
      • Contact
      • Imprint
      • Legal & Privacy
      • Partner With Us
Subscribe
No Result
View All Result
Dataconomy
No Result
View All Result

Chicago: City of Big Data

byEileen McNulty
May 17, 2014
in News
Home News
Share on FacebookShare on TwitterShare on LinkedInShare on WhatsAppShare on e-mail

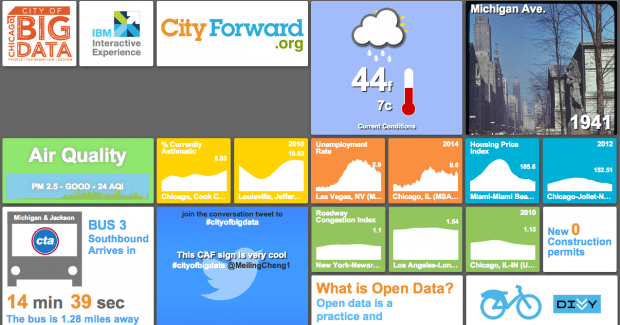
Chicago City of Big Data Dashboard

‘Did you know data has become a 21st century design material?’

This is the question posed by the exhibition, Chicago: City of Big Data. Most people are by now familiar with this overused term, but few are considering the way architects, planners and engineers are using Big Data to remould the urban spaces they inhabit. So began Chicago: City of Big Data, organised by the Chicago Architecture foundation- a free exhibit designed with aim of showing the citizens of Chicago how data is interwoven into the fabric of their everyday lives.

Stay Ahead of the Curve!

Don't miss out on the latest insights, trends, and analysis in the world of data, technology, and startups. Subscribe to our newsletter and get exclusive content delivered straight to your inbox.

According to Ingrid Haftel, the associate curator, the exhibition will allow visitors to:

  • See hidden digital infrastructure revealed at the intersection of Clark Street and Devon Avenue, through cameras that monitor city operations and public safety, for example;
  • Browse health information for broad disease categories in your neighborhood with Chicago Health Atlas;
  • Collect air quality data with Air Lab, a summer workshop that used sensors to collect data on indoor air quality in several residential buildings in Humboldt Park;
  • Explore the architecture of Big Data at the 1.1 million square foot, multi-tenant datacenter at 350 East Cermak Road, and;
  • Explore a year’s worth of bike share, Twitter, and 311 call data, visualized in real-time on a digital model created in collaboration with leading design firm Skidmore, Owings & Merrill.

Through the CAF’s partnership with IBM, the IBM Interactive Experience contributed The Chicago Dashboard, an interactive dashboard which displays stats about the city in real time.

There is also the option to create a personalised Data Trail. By contributing your daily activities and movements around the city, the Data Trail will show you how you individually contribute to the volume of data generated every day.

The exhibition aims to get people thinking, and create dialogues about the multi-faceted ways in which Big Data influences- and hopefully improves- our daily lives in urban environments.
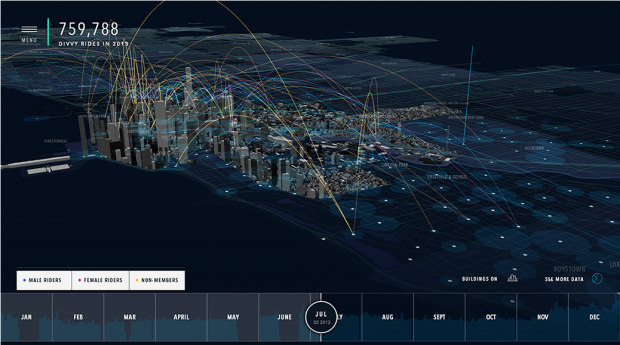
Chicago City of Big Data Exhibit

Read more about it here.
(Photo credit: The Chicago: A City of Big Data website)

Tags: Big DataChicagoNewssurveillanceVisualisations

Related Posts

The original Apple founding contract is heading to auction for  million

The original Apple founding contract is heading to auction for $4 million

November 27, 2025
EU Council drops CSAM scanning mandate for tech firms

EU Council drops CSAM scanning mandate for tech firms

November 27, 2025
Stranger Things mania crashed Netflix despite 30% more bandwidth

Stranger Things mania crashed Netflix despite 30% more bandwidth

November 27, 2025
ShadowV2 botnet exploited AWS outage timeline to test global IoT attacks

ShadowV2 botnet exploited AWS outage timeline to test global IoT attacks

November 27, 2025
Google rolls out Power Saving Mode in Maps for Pixel 10

Google rolls out Power Saving Mode in Maps for Pixel 10

November 27, 2025
Google streamlines Desktop Mode with per-monitor memory

Google streamlines Desktop Mode with per-monitor memory

November 27, 2025
Please login to join discussion

LATEST NEWS

The original Apple founding contract is heading to auction for $4 million

EU Council drops CSAM scanning mandate for tech firms

Stranger Things mania crashed Netflix despite 30% more bandwidth

ShadowV2 botnet exploited AWS outage timeline to test global IoT attacks

Google rolls out Power Saving Mode in Maps for Pixel 10

Google streamlines Desktop Mode with per-monitor memory

Dataconomy

COPYRIGHT © DATACONOMY MEDIA GMBH, ALL RIGHTS RESERVED.

  • About
  • Imprint
  • Contact
  • Legal & Privacy

Follow Us

  • News
    • Artificial Intelligence
    • Cybersecurity
    • DeFi & Blockchain
    • Finance
    • Gaming
    • Startups
    • Tech
  • Industry
  • Research
  • Resources
    • Articles
    • Guides
    • Case Studies
    • Glossary
    • Whitepapers
  • Newsletter
  • + More
    • Conversations
    • Events
    • About
      • About
      • Contact
      • Imprint
      • Legal & Privacy
      • Partner With Us
No Result
View All Result
Subscribe

This website uses cookies. By continuing to use this website you are giving consent to cookies being used. Visit our Privacy Policy.