Netflix viewing data has been released and it gives a great insight into what we enjoyed watching and the success of the popular streaming platform.
Netflix has taken a groundbreaking step by revealing its first-ever engagement report. The press conference, led by Ted San Rosa, co-CEO of Netflix, provided a deep dive into the platform’s viewing data, shedding light on crucial metrics that define the success of streaming services in today’s competitive market.
Taking a step that will set an example for every company in terms of transparency, Netflix has published the conversation in which officials made their presentations at an online meeting. You can access the Netflix What We Watched video below and you will understand why the platform is so successful with what we will tell you in the following parts of our writing.
Netflix What We Watched video reveals Netflix viewing data
At the core of Netflix’s strategy lies the concept of engagement. Ted San Rosa highlighted how the platform’s focus is on getting users to press play and stay. For Netflix, engagement isn’t just about numbers; it’s about delighting members, keeping them satisfied, and, ultimately, building a thriving business.
The engagement report revealed at Netflix What We Watched video, a comprehensive exploration into what people are watching, is positioned as a crucial milestone for the entire streaming industry.

These are the Top 10 most popular English films according to the Netflix viewing data:
- Red Notice– 230,900,000 views
- Don’t Look Up– 171,400,000 views
- The Adam Project– 157,600,000 views
- Bird Box-157,400,000 views
- The Gray Man– 139,300,000 views
- We Can Be Heroes– 137,300,000 views
- The Mother– 136,400,000 views
- Glass Onion: A Knives Out Mystery– 136,300,000 views
- Extraction– 135,700,000 views
- Extraction 2-134,900,000 views
And these were the Top 10 most popular English TV series according to Netflix viewing data:
- Wednesday: Season 1– 252,100,000 views
- Stranger Things 4– 140,700,000 views
- DAHMER: Monster: The Jeffrey Dahmer Story– 115,600,000 views
- Bridgerton: Season 1– 113,300,000 views
- The Queen’s Gambit: Limited Series– 112,800,000 views
- The Night Agent: Season 1– 98,200,000 views
- Stranger Things 3- 94,800,000 views
- Bridgerton: Season 2– 93,800,000 views
- The Witcher: Season 1– 83,000,000 views
- Queen Charlotte: A Bridgerton Story– 81,300,000 views
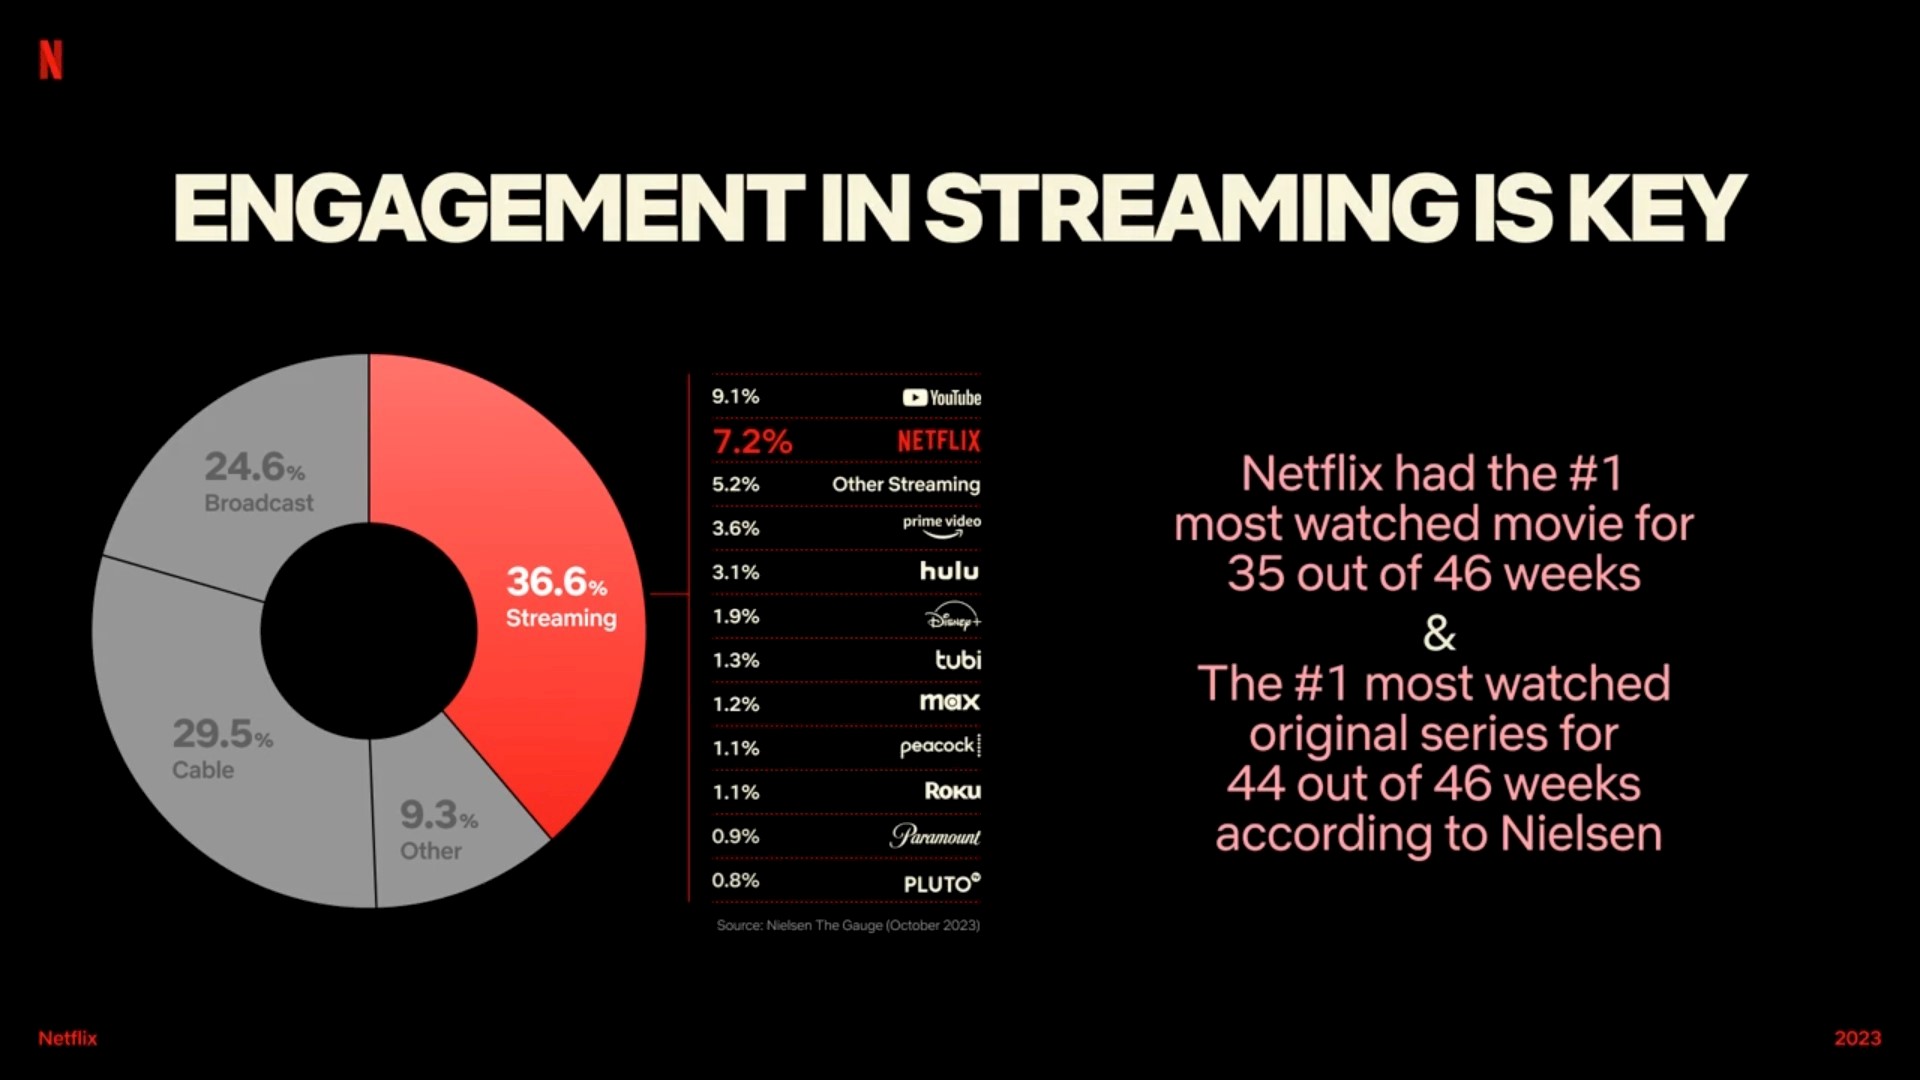
One of the central themes in the press conference was the measurement of engagement through view hours. Ted San Rosa explained that view hours serve as an effective and easily understandable metric. It not only aligns with industry standards, such as Nielsen in the US but also facilitates straightforward comparisons with other streaming services. As streaming becomes more mainstream, transparency has become a key objective for Netflix, and view hours provide a clear and transparent way to evaluate performance.

Transparency at its finest
Netflix’s journey towards transparency has been a gradual process. Lauren Smith, Vice President of Strategy and Analysis, pointed out that the platform started by publishing top 10 lists two years ago. These lists provided a glimpse into the most-watched titles across film and television. However, the unveiling of the engagement report takes transparency to a new level, offering a broader scope and more detailed insights into the viewing habits of Netflix’s vast audience.
How Netflix Uses Big Data to Drive Success
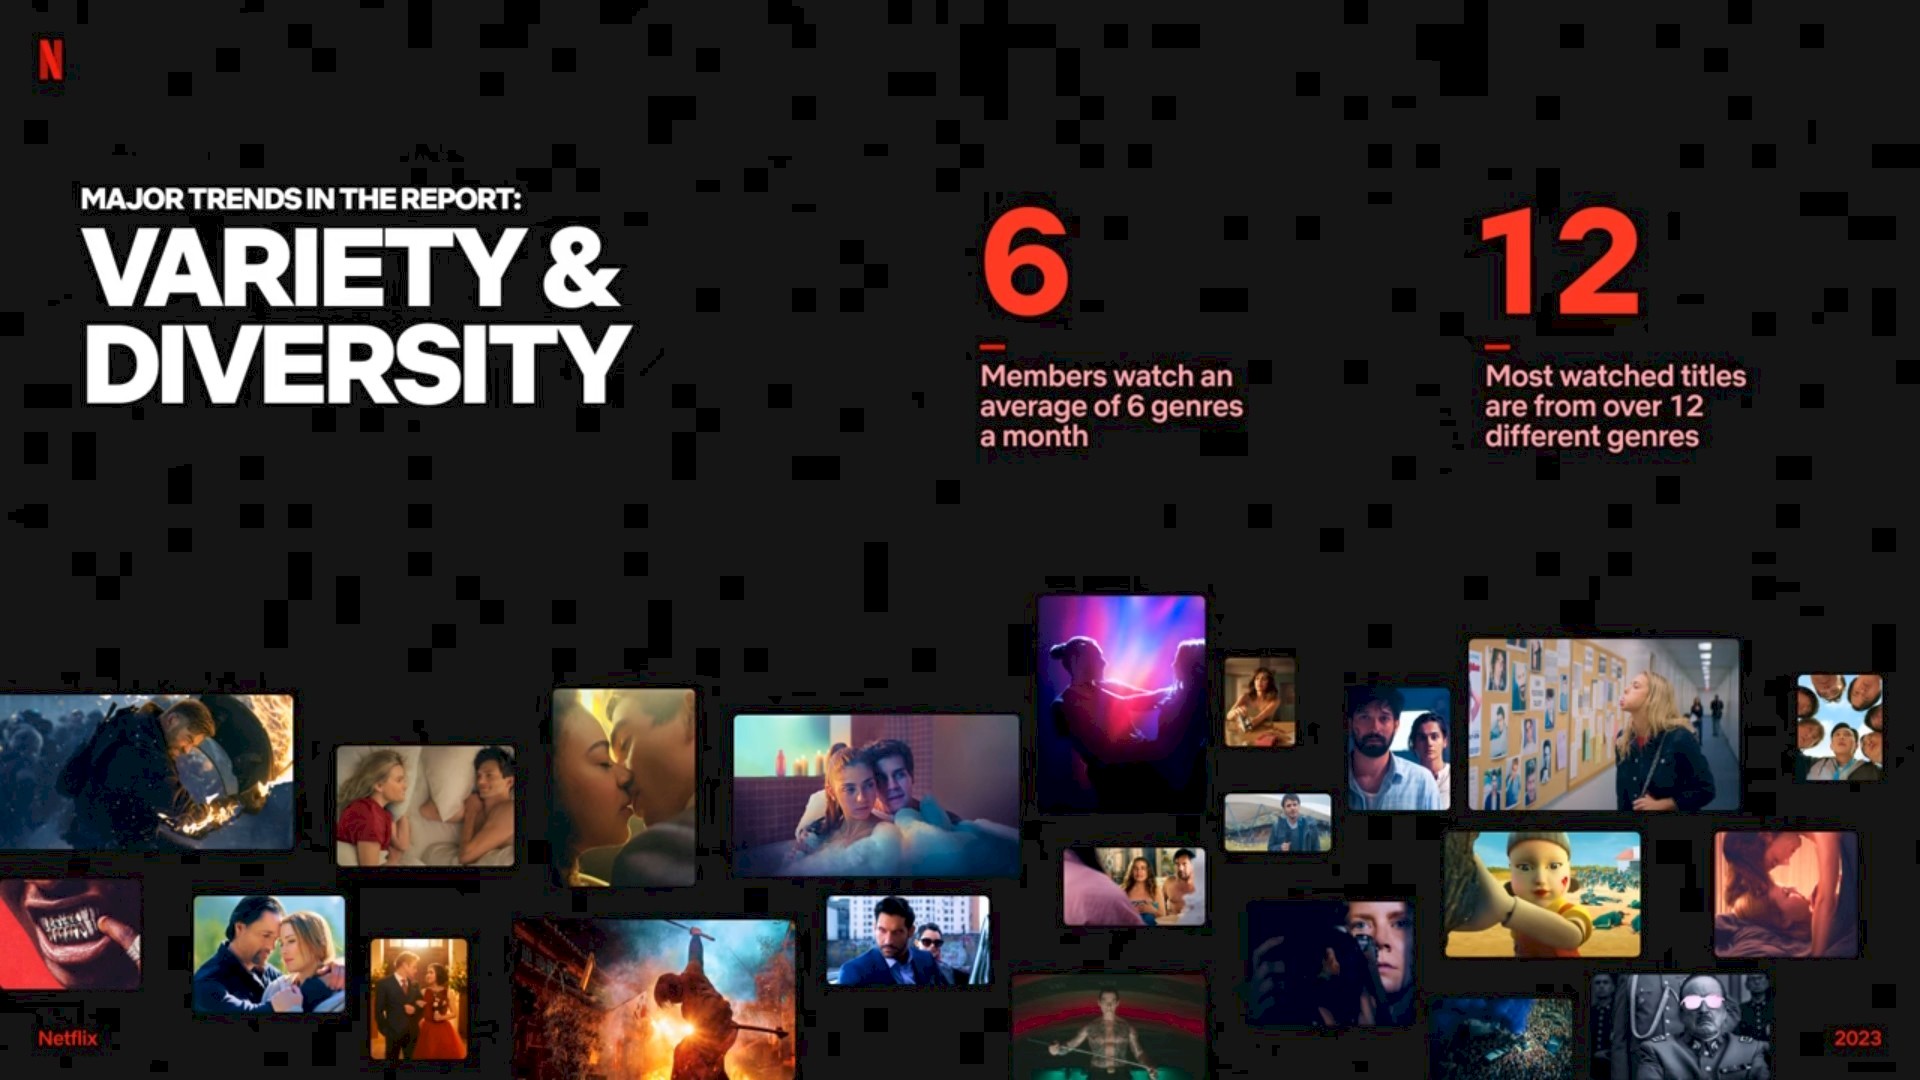
Lauren Smith delved into the details of the report, emphasizing its importance at the Netflix What We Watched video. The report, to be published biannually, covers hours viewed for all titles, both original and licensed, watched for more than 50,000 hours between January and June 2023. It encompasses over 18,000 titles and nearly 100 billion hours, capturing a staggering 99% of all viewing on Netflix. The key takeaways include the variety and diversity of genres that Netflix users explore, showcasing the platform’s ability to cater to a myriad of tastes.
Being able to appeal to everyone is the key to success
The report from Netflix What We Watched video emphasizes that success on Netflix is not confined to specific metrics. Titles like “The Night Agent” and “Rhythm and Flow” showcase the platform’s ability to thrive on diverse content, with varying levels of view hours.
This dynamic approach to success reflects Netflix’s commitment to pleasing its audience with content that resonates, regardless of conventional expectations.
Non-English content was a hit
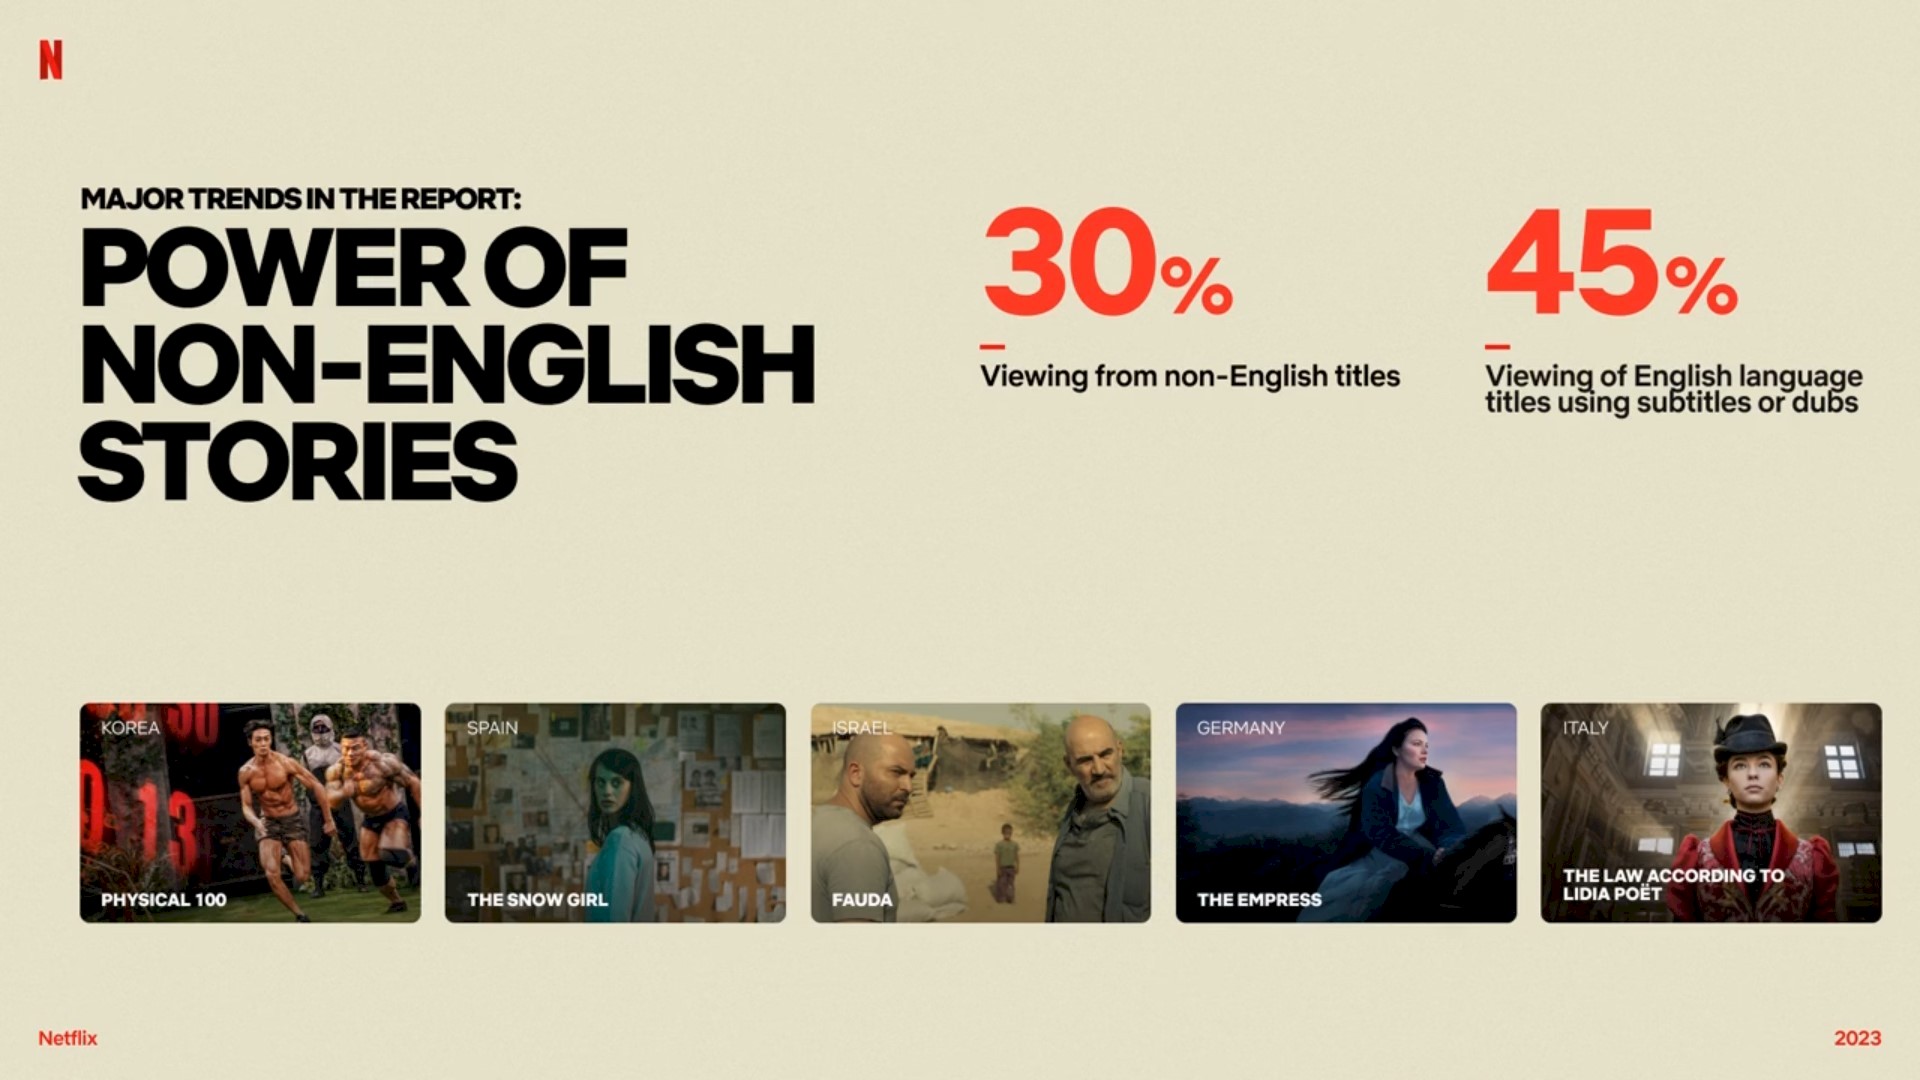
A notable aspect of the report is the global impact of Netflix. Non-English language titles accounted for 30% of viewing in the first half of the year, demonstrating the platform’s global reach. Despite the global perspective, Ted San Rosa clarified that local original programming is designed to thrill local audiences first. This dual focus on global impact and local relevance contributes to Netflix’s success on a worldwide scale.
How popular were they? Well, according to Netflix viewing data these are the Top 10 most popular non-English films:
- Troll– 103,000,000 views
- The Platform– 82,800,000 views
- Nowhere– 82,700,000 views
- Through My Window– 61,100,000 views
- AKA– 60,900,000 views
- Blood Red Sky– 60,900,000 views
- My Name Is Vendetta– 56,400,000 views
- Black Crab– 53,900,000 views
- All Quiet on the Western Front 1– 52,100,000 views
- Below Zero- 48,600,000 views
And these are the most popular non-English TV series from the Netflix What We Watched video:
- Squid Game: Season 1– 265,200,000 views
- Money Heist: Part 4– 106,000,000 views
- Lupin: Part 1– 99,500,000 views
- Money Heist: Part 5– 99,200,000 views
- Money Heist: Part 3– 80,000,000 views
- Lupin: Part 2– 68,400,000 views
- Who Killed Sara?: Season 1– 58,400,000 views
- All of Us Are Dead: Season 1– 55,500,000 views
- Dear Child: Limited Series– 50,900,000 views
- Elite: Season 3– 50,000,000 views

Insights from the Q&A session
During the Q&A session, several important insights emerged. Ted San Rosa clarified that the data shared is the actual data used to run the business, emphasizing Netflix’s commitment to transparency. Regarding future data releases, there’s an acknowledgment of the time required to compile the report, and efforts are underway to potentially enhance future releases.
As Netflix continues to evolve, the engagement report represents a crucial tool for creators, industry analysts, and audiences. The transparency provided not only gives a snapshot of viewing trends but also empowers creators with insights into what resonates with audiences globally. The data shared offers a glimpse into the intricate balance Netflix maintains between original and licensed content, showcasing the platform’s dynamic approach to programming.
Featured image credit: Thibault Penin/Unsplash.


