The pursuit of writing clean, reliable, and high-performing code is a constant challenge for developers but luckily dynamic code analysis is here to help. As software applications become increasingly complex, it becomes imperative to adopt effective techniques that can uncover potential issues and enhance the overall quality of the codebase.
Dynamic code analysis is a powerful approach that allows developers to gain deeper insights into their code’s behavior during runtime. It goes beyond traditional static analysis by providing a real-world perspective on how the code actually performs in different scenarios and environments. By executing the code and examining its outcomes, dynamic code analysis offers invaluable feedback for optimizing performance, identifying runtime-specific issues, and ensuring the robustness of software applications.
For software developers, the benefits of utilizing dynamic code analysis are manifold. It empowers them to validate their assumptions, catch unforeseen bugs, and improve the overall reliability of their code. By leveraging dynamic code analysis, developers can unleash the full potential of their software applications, delivering a seamless user experience and mitigating the risks associated with faulty code.

What is dynamic code analysis?
Dynamic code analysis refers to a software testing technique that involves the evaluation of code behavior during runtime. It entails executing the code and examining its actual execution paths, data flows, and interactions with the system or environment. By dynamically analyzing the code as it runs, developers and testers can gain insights into its behavior, performance, and potential issues that may arise in real-world scenarios.
Dynamic code analysis provides a more realistic understanding of how the code operates, allowing for the identification of runtime-specific problems such as memory leaks, performance bottlenecks, and unexpected behaviors. This technique helps ensure that the code functions as intended and meets the desired specifications.
Various tools and approaches can be employed for dynamic code analysis. Profilers are commonly used to measure the code’s performance and resource usage during execution. Test frameworks facilitate the creation and execution of test cases to verify the behavior of the code under different scenarios. Additionally, debugging tools assist in identifying and resolving issues encountered during runtime.
Dynamic code analysis complements static code analysis, which focuses on examining the code without execution, by providing a deeper understanding of the code’s runtime behavior.

Static vs dynamic code analysis
The distinction between static and dynamic code analysis lies in their approaches and objectives. In static code analysis, the focus is on examining the code itself to pinpoint potential issues related to logic and techniques.
On the other hand, dynamic code analysis involves the execution of the code and thorough examination of its outcomes, which encompasses the testing of various possible execution paths.
Here is a comparison table of static vs dynamic code analysis:
| Static code analysis | Dynamic code analysis |
| Focuses on examining the code itself to identify potential issues related to logic and techniques. | Involves running the code and examining its outcomes, including testing various execution paths. |
| Analyzes the code without executing it, typically through automated tools or manual code review. | Requires the execution of the code to observe its behavior and collect runtime information. |
| Detects issues such as coding errors, security vulnerabilities, and adherence to coding standards. | Identifies issues that may only manifest during runtime, such as performance bottlenecks and memory leaks. |
| Offers a comprehensive view of the codebase and can catch potential problems early in the development process. | Provides insights into how the code behaves in real-world scenarios and can uncover issues that are difficult to detect statically. |
| Can be integrated into the development workflow and run automatically as part of the build process. | Usually performed manually or through the use of specialized testing tools during the testing phase. |
| Helps identify potential problems and improve code quality, but may produce false positives or miss certain runtime-specific issues. | Provides a more accurate representation of the code’s behavior but may require more resources and time for analysis. |
| Examples of static analysis tools include linters, code review tools, and IDE integrations. | Examples of dynamic analysis tools include profilers, test frameworks, and debugging tools. |
Even in its most basic form, when development teams carry out code testing, they are essentially performing dynamic code analysis. Likewise, when programmers review the code, they are engaging in static analysis. Regardless of the specific tools employed, both developers and programmers contribute to the analysis process, which ultimately aids in the creation of higher-quality code.
It is crucial to recognize that neither static nor dynamic code analysis alone can be considered the optimal choice. Therefore, it is imperative for teams to optimize and leverage the benefits of both approaches. Rather than viewing static and dynamic code analysis as mutually exclusive alternatives, it is more prudent to regard them as complementary and symbiotic, each serving a distinct purpose in enhancing code quality.
Why is dynamic code analysis important for your software development?
Dynamic code analysis plays a crucial role in ensuring the quality, reliability, and performance of software applications.
Here are several reasons why dynamic code analysis is important:
- Identifying runtime issues: Dynamic analysis allows developers to observe how the code behaves in real-world scenarios during runtime. It helps uncover potential issues that may only manifest when the code is executed, such as memory leaks, race conditions, or unexpected behaviors. By detecting and addressing these runtime issues, software applications can deliver a more robust and reliable user experience.
- Performance optimization: Dynamic code analysis provides insights into the performance characteristics of the code. Profiling tools, for example, help identify performance bottlenecks, inefficient algorithms, or excessive resource consumption. By analyzing the code’s runtime behavior, developers can optimize critical sections, enhance scalability, and improve overall system performance.
- Validation of assumptions: Dynamic analysis allows developers to validate their assumptions about how the code interacts with different components, systems, or user inputs. It helps uncover unforeseen issues that may arise when the code is executed in various environments or with specific data sets. By validating assumptions during runtime, developers can ensure that the code behaves as expected across different scenarios.
- Testing complex scenarios: Dynamic code analysis enables the creation and execution of test cases that simulate complex scenarios and real-world conditions. This approach helps identify edge cases, boundary conditions, and corner cases that may not be easily identified through static analysis alone. By testing the code dynamically, developers can verify its behavior under a wide range of conditions, improving test coverage and enhancing software reliability.
- Continuous improvement: Dynamic code analysis provides valuable feedback for continuous improvement. By analyzing runtime behavior, developers can gather metrics, collect runtime information, and gain insights into system usage patterns. This data can then be used to identify areas for optimization, prioritize bug fixes, and drive iterative enhancements in subsequent software iterations.

What are the best dynamic code analysis tools?
There are several widely used dynamic code analysis tools that provide valuable insights into the behavior and performance of software applications. The selection of the best dynamic code analysis tool depends on various factors, such as the programming language, the specific requirements of the project, and the expertise of the development team. Evaluating and choosing the appropriate tool should be based on these considerations to effectively address the needs of the software application being developed.
Profilers
Profilers help measure and analyze the performance of the code during runtime. They provide information about resource usage, execution times, and method-level performance.
Best profilers for software development include:
- Py-spy
- Java VisualVM
- Pyroscope
Py-spy
Py-spy serves as an exceptional sampling profiler designed specifically for Python. This powerful tool offers a glimpse into the inner workings of your Python-based application, revealing where exactly it spends its time.
The beauty of py-spy lies in its non-intrusive nature. You don’t need to modify your code or restart the program entirely to benefit from its insights. Built-in Rust for optimal performance, py-spy ensures low overhead and operates separately from your profiled Python program. This separation guarantees the safety and security of your production Python-based code.
With py-spy, you gain the ability to capture profiles and generate interactive SVG flame graphs. Furthermore, you have the flexibility to adjust sampling rates, profile native C extensions, and monitor subprocesses and thread IDs, among other options. The ”top” command offers a live view of active functions within your programs, while the ”dump” command provides the current call stack for each Python thread.
The versatility of py-spy extends to its compatibility with various versions of the CPython interpreter, encompassing 2.3 to 2.7 and 3.3 to 3.8. Installing py-spy is a breeze, as it is readily available on both PyPI and GitHub.
Java VisualVM
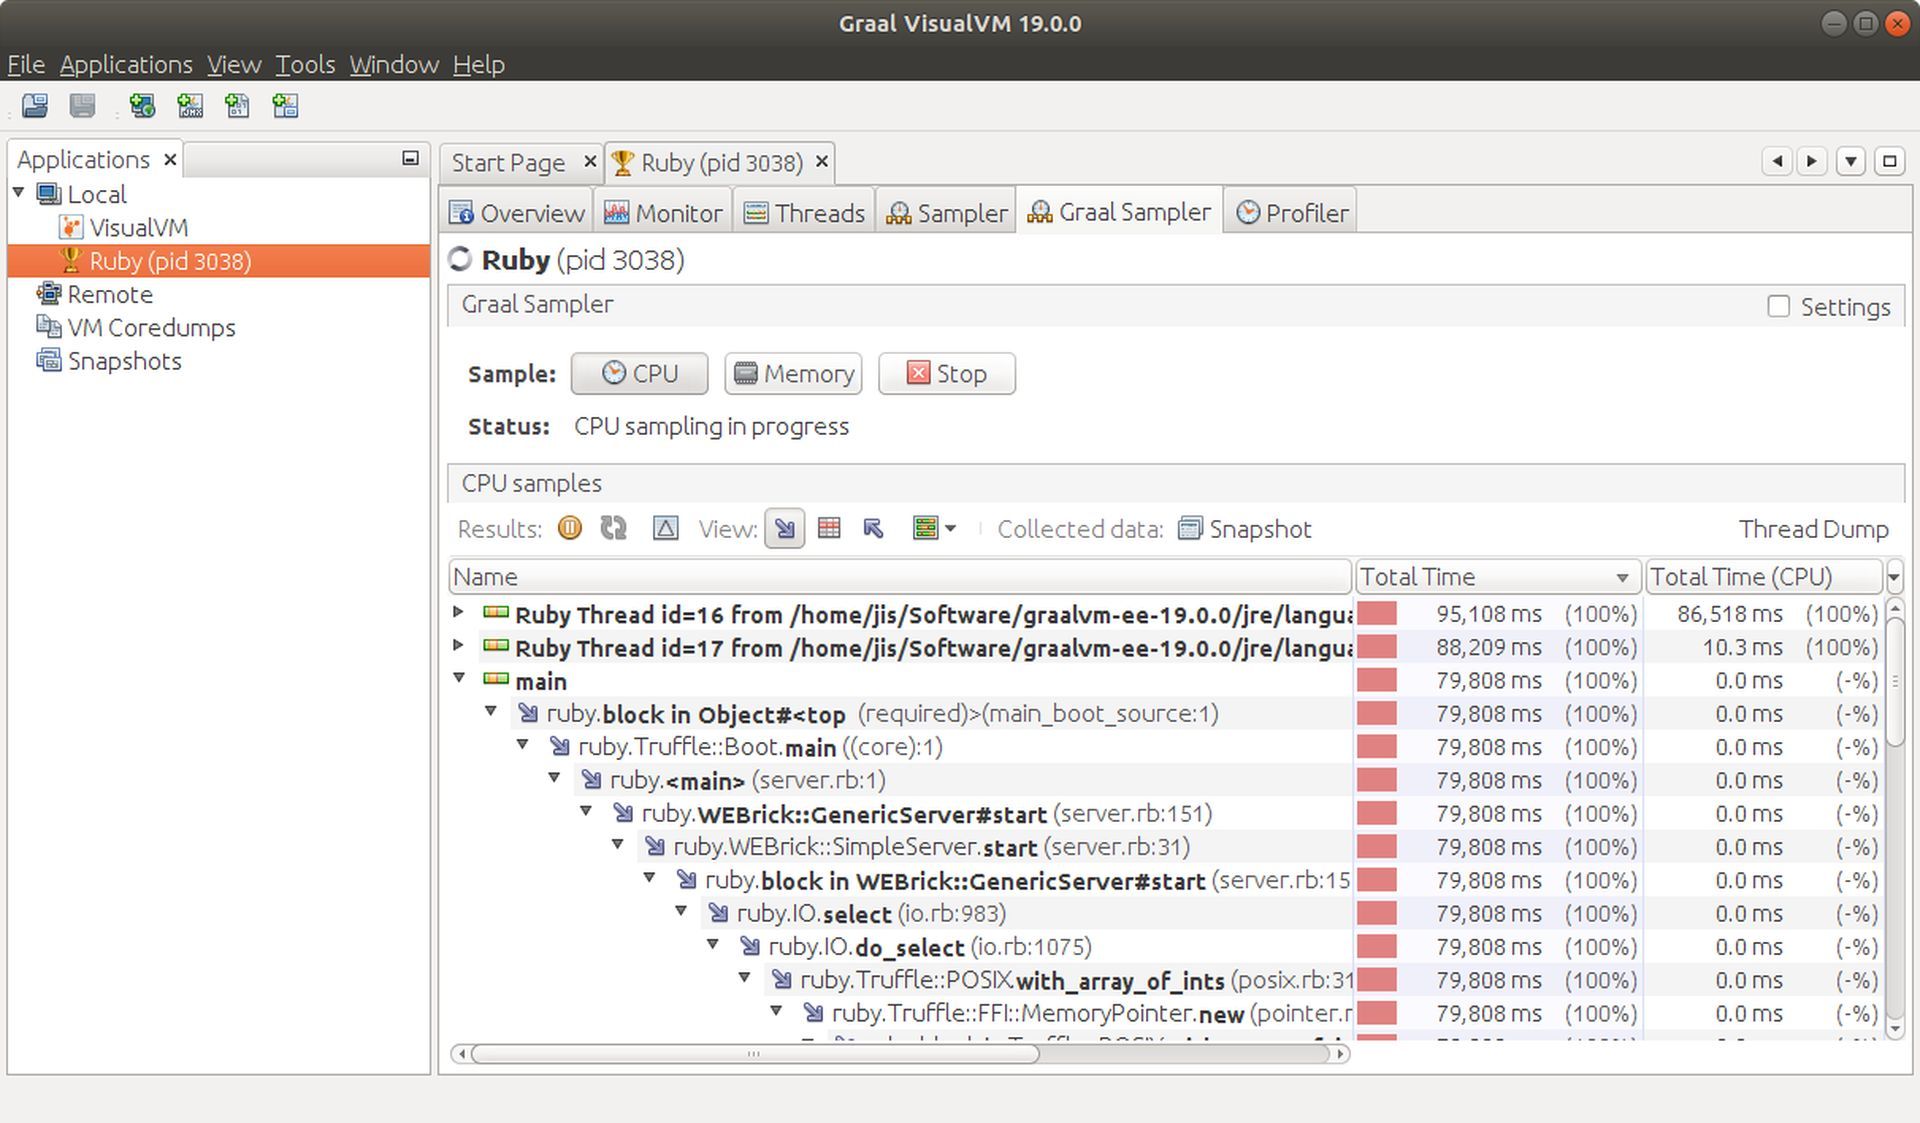
VisualVM, the comprehensive troubleshooting tool for Java, offers a versatile solution that caters to both the production and development phases. This powerful software combines visual capabilities with lightweight profiling functionalities and command-line JDK tools.
Designed to monitor Java applications running on Java 1.4+ and equipped with various technologies such as JMX, jvmstat, Attach API, and Serviceability Agent, VisualVM is an invaluable asset for quality engineers, system administrators, and end-users alike.

VisualVM automatically detects both locally and remotely running Java-based applications, presenting a comprehensive list for easy access. Additionally, it allows manual definition of programs through JMX connections. For each process, essential runtime data such as PID, command-line arguments, JDK home, main class, JVM flags, JVM version, system properties, and argument properties are displayed.
Compatible with Windows, Linux, and Unix, VisualVM stands as a reliable and versatile troubleshooting tool for Java developers and administrators, empowering them to identify and resolve issues efficiently.
Pyroscope
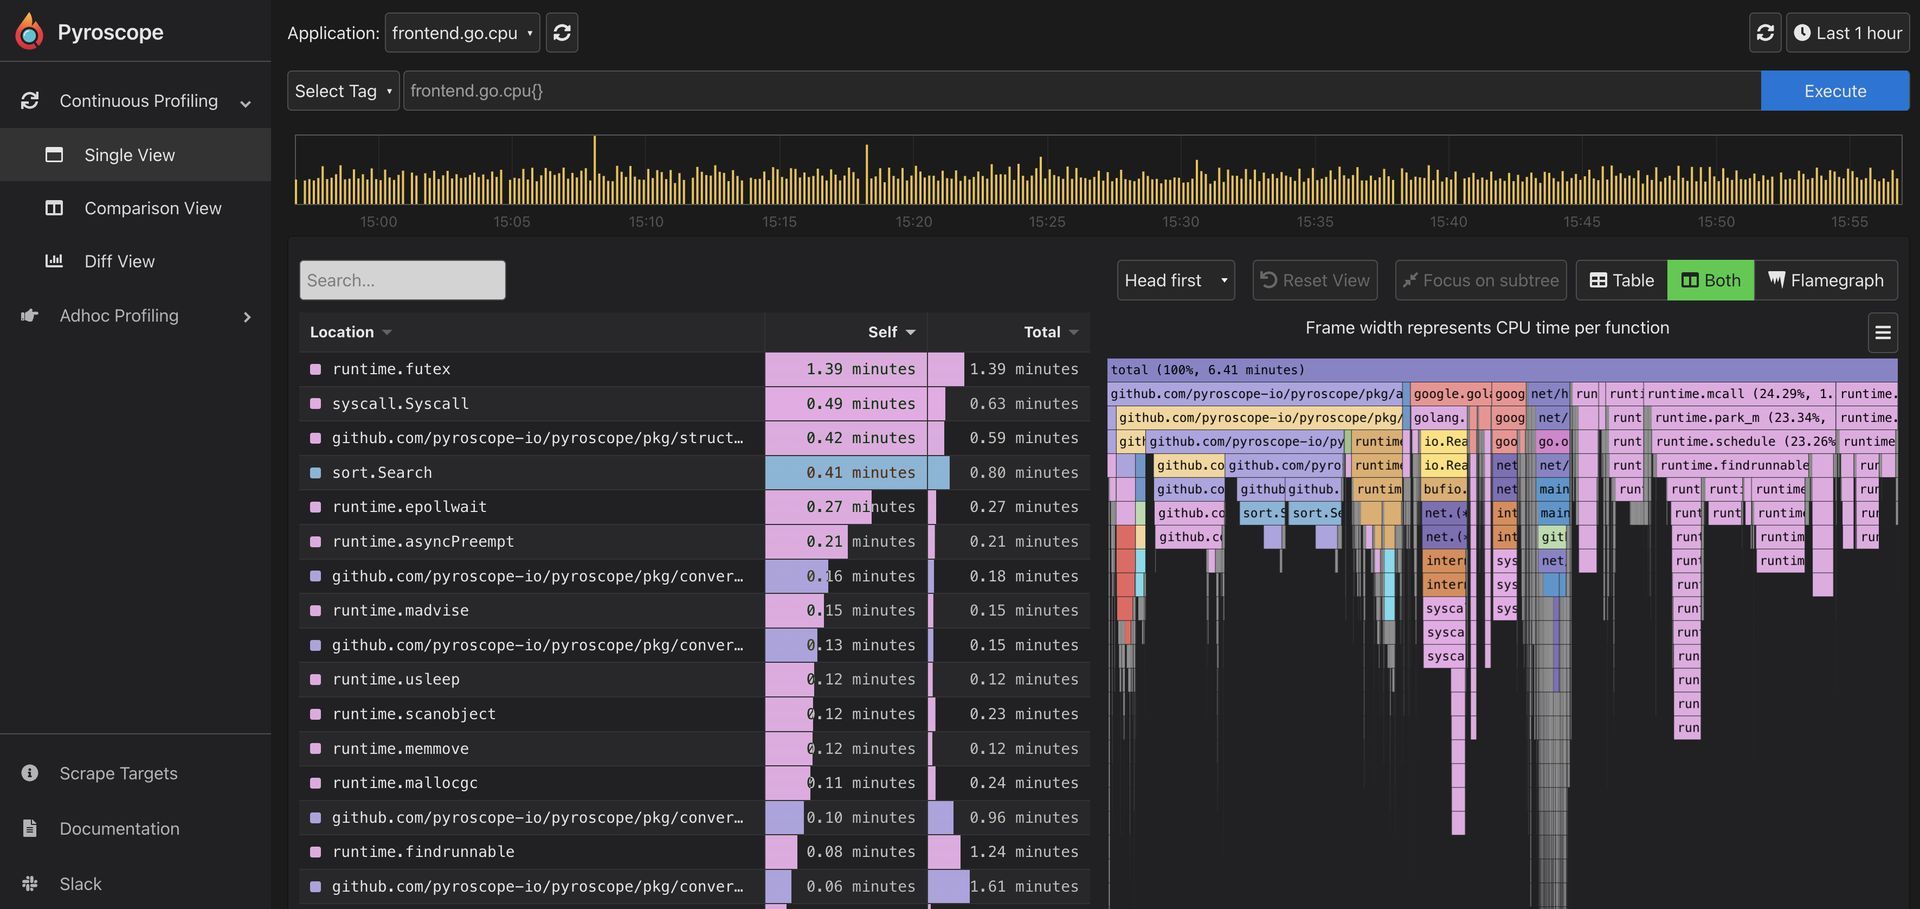
Pyroscope, an open-source continuous profiling software, offers a speedy and efficient solution for debugging performance issues within your application. In a matter of minutes, you can gain valuable insights and identify areas of improvement.
Setting up Pyroscope is a breeze, regardless of whether you are using Docker, Linux, or seeking documentation for Ruby or Go. Simply start the server and agent, and Pyroscope has you covered. Whether you require profiling data for ten seconds or ten months, Pyroscope’s custom-designed storage engine enables fast queries, ensuring a seamless profiling experience.

One of the remarkable features of Pyroscope is its minimal overhead and impact on application performance. By utilizing sampling profiling technology, Pyroscope ensures that your application’s performance remains unaffected while providing accurate profiling data. You can rely on Pyroscope to efficiently store your profiling data, making it a cost-effective solution, even if you need to store data from multiple applications over an extended period.
Pyroscope is compatible with macOS, Linux, and Docker, making it accessible across various platforms. Furthermore, it supports programs written in Python, Go, and Ruby, offering flexibility and support for a wide range of applications.
Test frameworks
Test frameworks facilitate the creation and execution of test cases to validate the behavior of the code. They allow developers to simulate various scenarios and verify that the code functions as expected.
Well-known test frameworks include:
- JUnit for Java
- NUnit for .NET
- Pytest for Python
JUnit
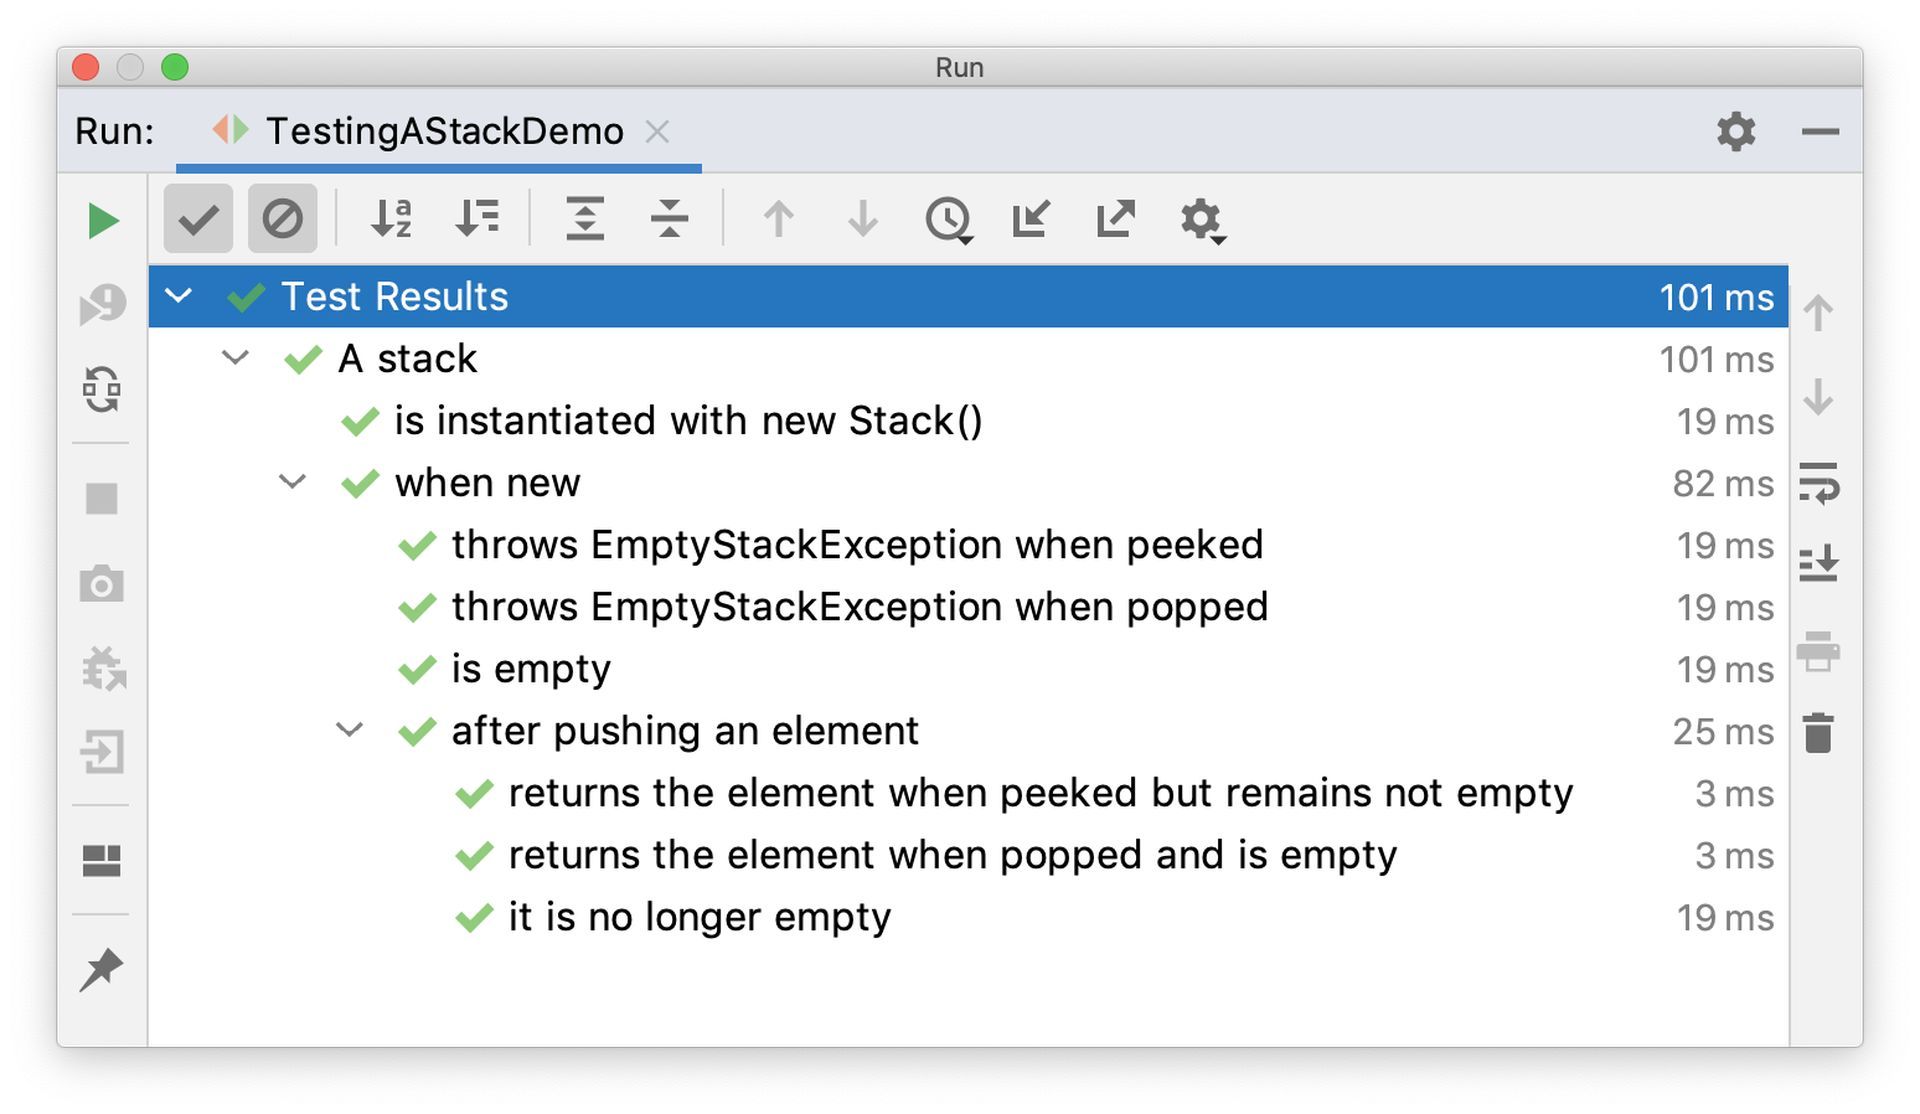
JUnit, an indispensable unit testing framework for the Java programming language, stands as a cornerstone in the realm of software development. Its significance extends beyond mere testing, as JUnit has played a vital role in the advancement and popularization of test-driven development (TDD) methodologies. This innovative approach to software development emphasizes writing tests before implementing the actual code, fostering a robust and reliable codebase.
JUnit’s impact on the software development landscape is further amplified by its position within the broader family of unit testing frameworks collectively known as xUnit. The inception of JUnit laid the foundation for the creation of a standardized framework that could be adapted and extended for various programming languages. This family of frameworks shares a common lineage, stemming from JUnit’s pioneering work in promoting structured unit testing practices.

Together, JUnit and dynamic code analysis empower software developers to build resilient and high-quality applications. By embracing the principles of TDD and leveraging the capabilities of dynamic code analysis, developers can create codebases that are not only thoroughly tested but also optimized for efficiency, reliability, and maintainability. These techniques form an integral part of the modern software development toolkit, enabling developers to deliver robust and dependable software solutions that meet the ever-increasing demands of the industry.
NUnit
NUnit, an open-source unit testing framework specifically designed for the .NET Framework and Mono, holds a prominent place in the world of .NET development. Similar to JUnit in the Java ecosystem, NUnit serves the crucial purpose of enabling developers to conduct effective unit tests to ensure the quality and reliability of their code. As part of the esteemed xUnit family of testing frameworks, NUnit brings a wealth of features and capabilities to the table.
One of NUnit’s key strengths lies in its versatility and flexibility when it comes to test execution. Tests can be effortlessly run using various methods, such as through a console runner, within Visual Studio with the assistance of a Test Adapter, or via third-party runners. Additionally, NUnit offers support for parallel test execution, allowing developers to optimize testing time and efficiency.
Will AI-automated code production make human programmers obsolete?
Data-driven tests, a powerful technique for testing multiple scenarios using different input data, are fully supported by NUnit. This feature enables developers to write concise and expressive tests that can handle a wide range of input variations, ensuring thorough test coverage.
NUnit’s compatibility extends beyond the traditional .NET Framework, as it also supports multiple platforms, including .NET Core, Xamarin Mobile, Compact Framework, and Silverlight. This broad platform support enables developers to write unit tests for their applications regardless of the target platform, ensuring consistent quality across different environments.
Pytest
Pytest, a powerful testing framework for Python, revolutionizes the way developers approach testing their code. While Python’s built-in unittest module provides a solid foundation for writing unit tests, it has its limitations.
To overcome these shortcomings, pytest emerges as a popular and highly versatile alternative. It offers a feature-rich and plugin-based ecosystem that enhances testing productivity and simplifies the testing experience.

Debugging tools
Debuggers assist in the identification and resolution of issues encountered during runtime. They provide features like breakpoints, stepping through code, and inspecting variables to analyze the code’s execution flow and diagnose problems.
Common debugging tools you may use for dynamic code analysis include:
- gdb for C/C++
- Visual Studio Debugger for .NET
- pdb for Python
Fuzz testing tools
Fuzz testing tools generate a large volume of random or mutated inputs to test the robustness and security of the code. By subjecting the code to unexpected or invalid inputs, these tools help uncover vulnerabilities, crashes, and unexpected behaviors.
Popular fuzz testing tools include:
- AFL
- Peach Fuzzer
- OWASP ZAP
Dynamic analysis security testing (DAST) tools
DAST tools evaluate the security of web applications by analyzing their behavior during runtime. They simulate attacks and assess vulnerabilities such as injection flaws, cross-site scripting (XSS), and insecure configurations.
Well-known DAST tools include
- Invicti
- Acunetix
- Indusface WAS
Dynamic code analysis has become an indispensable tool for modern software development. Its ability to uncover hidden issues, enhance code quality, and facilitate efficient development processes makes it a crucial asset in creating reliable, secure, and high-performing software applications. By utilizing the power of dynamic code analysis, developers can stay ahead in the rapidly evolving area of software development and deliver exceptional products that meet and exceed user expectations.


