IoT data offers answers to a simple question: “Are things changing or staying the same?”
There are new data streams generated each day, that make it possible to quantify the formerly unquantifiable. The Internet of Things (IoT) enables us to measure processes and react more quickly to ever-evolving conditions, not only in industrial settings, but also in the spaces closest to us – a home’s energy consumption, a patient’s vital signs, real time social interactions among machines, companies and people, just to name a few.
Some experts’ forecasts estimate that there will be upwards of 30 billion connected IoT devices by 2020. Smart cities, connected cars, logistics and industrial equipment will all be changed by IoT. With this new information come new opportunities for optimization and prediction. However, some industries are discovering the challenging differences between IoT data and other streams of analytics data.

This e-book shows you how to find useful patterns in IoT data and how to use them to predict and model successfully.
Many companies already collect plenty of data, mostly for creating reports and dashboards. Some of the approaches and workflows for working with these high dimensional, high volume streaming data are easily adapted from existing applications and other domains, but not all. Before using the data for optimizing business processes, analysts must put a few things in place.
Setting up a ‘Data Historian’
A Data Historian is the place where data are indexed and made available for analytic software and routines – be it a standard database or data warehouse
Finding out what you need to predict
In order to find interesting patterns for their models, analysts can rely on the analytic strategies that are used for other data sets, such as:
- Aggregating and aligning data
- Determining aggregation intervals
- Forecasting and predicting in the time domain
- Modeling trajectories and multivariate anomaly detection
- Finding inflection points
Now that the proper mechanisms are set in place to get exactly the right data you need, Statistica presents the tool that brings the math to the data.

Click here to download the e-book!
Native Distributed Analytics – Taking the math to the data, wherever they are
Given that the worldwide amount of connected devices is rising at an increasing rate, the ability to collect data will quickly outpace a company’s ability to analyze it. This could mean overburdened networks, unclear objectives for data analysis, and ultimately, higher efforts needed to really boost a company’s bottom line. The goal is to detect “something interesting” – state changes, anomalies, trends and inflection points – and use that information for the analytics process.
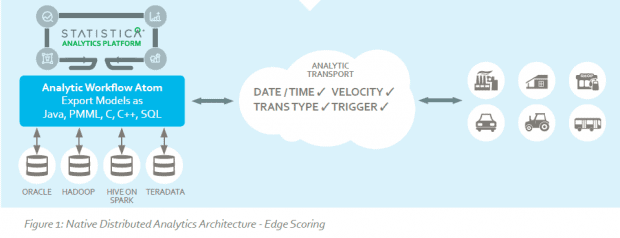
A Native Distributed Analytics Architecture (NDAA) runs analytics on aggregates computed in a database, gateway or device/sensor, wherever it may reside. This is what the workflow looks like:
- Users build an analytical model, such as a neural network.
- They export the model in the languages (Java, C, C++, PMML, SQL) appropriate to the platforms (Hadoop, Teradata, Netezza, Exadata) on which the data reside.
- The models execute platform-specific operations and user-defined functions.
- The results return to desktop software, where visualisation technology displays them to analysts and users..
How to effectively measure with IoT data
IoT technologies hold the promise of delivering new data, information and insights in industrial applications like patient monitoring and automated manufacturing. The next hurdle, as described in this e-book, is to tailor traditional analytics techniques to IoT data. Analysts can then derive useful and actionable information from such data and figure out how to make IoT work for both industry and consumers.
Who should read the ‘Analytic Strategies for the Internet of Things’ e-book?
As analytical tools become intuitive and easy to use, gone are the days when only statisticians and those with PhDs in mathematics could unlock the power in data to innovate. In today’s world, with easily available and accessible data, big or small – fast or at rest, analytics is becoming democratized.
Read this e-Book if:
- you are interested in newforms of data, but are just starting out, or
- are already data native working on complex data modelling
Download your free copy of ‘Analytic Strategies for the Internet of Things’ here!
Like this article? Subscribe to our weekly newsletter to never miss out!


