Dataconomy
  • News
    • Artificial Intelligence
    • Cybersecurity
    • DeFi & Blockchain
    • Finance
    • Gaming
    • Startups
    • Tech
  • Industry
  • Research
  • Resources
    • Articles
    • Guides
    • Case Studies
    • Glossary
    • Whitepapers
  • Newsletter
  • + More
    • Conversations
    • Events
    • About
      • About
      • Contact
      • Imprint
      • Legal & Privacy
      • Partner With Us
Subscribe
No Result
View All Result
  • AI
  • Tech
  • Cybersecurity
  • Finance
  • DeFi & Blockchain
  • Startups
  • Gaming
Dataconomy
  • News
    • Artificial Intelligence
    • Cybersecurity
    • DeFi & Blockchain
    • Finance
    • Gaming
    • Startups
    • Tech
  • Industry
  • Research
  • Resources
    • Articles
    • Guides
    • Case Studies
    • Glossary
    • Whitepapers
  • Newsletter
  • + More
    • Conversations
    • Events
    • About
      • About
      • Contact
      • Imprint
      • Legal & Privacy
      • Partner With Us
Subscribe
No Result
View All Result
Dataconomy
No Result
View All Result

Data Around the World – Part VIII: The End of the Tour

byMarianne FaroandGijs Wobben
November 4, 2016
in Articles, Contributors, Transportation & Logistics
Home Resources Articles

The STORM team is back home. In 80 days, they have traveled the earth, showing that electric driving is possible – and very cool. They showed that a strong team can accomplish amazing things and change the world, by building their own bike and traveling around the world with it.

Digital transformation

The STORM team has made digital transformation come to life. They have used multiple digital media channels to reach out to an ever growing community. Via daily vlogs, tweets, facebook posts and paper.li they shared on a daily basis what they were doing. And the app www.follow.storm-eindhoven.com allowed anyone, anywhere, to follow the trip. Via a combination of data sources (the electric bike, the whereabouts of the team via a GPS tracker, the social media activity) and visualizations of that data, everyone was able to see where the team was and what they were doing.

Stay Ahead of the Curve!

Don't miss out on the latest insights, trends, and analysis in the world of data, technology, and startups. Subscribe to our newsletter and get exclusive content delivered straight to your inbox.

Hence: digital transformation – using digital tools to create an experience. It was not just about the product “electric bike”, it was about the experience “the journey”; and everyone everywhere could participate and travel along.

Data facts of the tour in an infographic

While the STORM team was traveling the last stage on November 2, we assembled a set of facts on their 80-day tour.

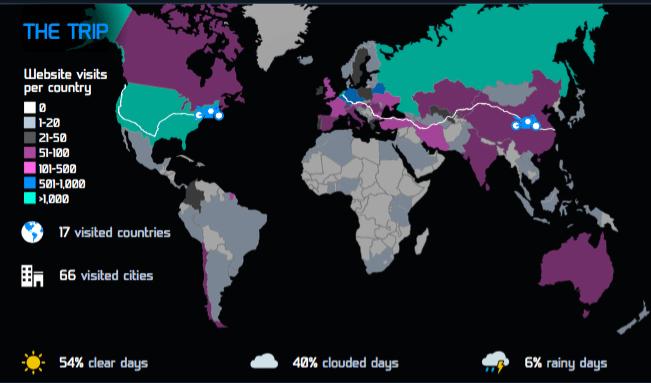
The Trip

The STORM team visited an amazing number of 17 countries in those 80 days. But the number of countries where people followed the experience was much larger: of the total 194 countries in the world, people from 103 countries followed the STORM tour (see heatmap).
021116-the-trip

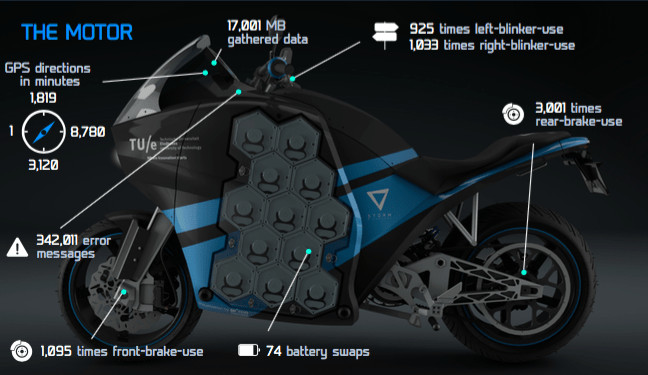
The Bike

In 80 days, the motor used the rear brake more than the front brake, and went slightly more to the right than to the left (according to the blinkers). As we saw in the last hackathon, speed was higher when moving eastwards than when moving to other directions. Luckily the tour went mainly east (8.780 minutes of 13.720 total driving minutes).
021116-the-bike

The App

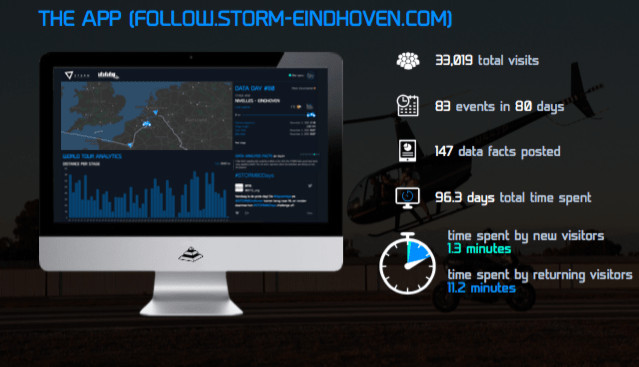
The app was visited more than 33.000 times, and many visitors were returning visitors, checking the whereabouts of the STORM-team on a regular basis (some even daily! We heard ‘complaints’ such as “so what do I read now in the morning with my first cup of coffee…?”).

The team had 83 events, where they shared the electric driving experience and the fact that a team of students can accomplish the impossible if they work cleverly together. At companies, at universities, but maybe most importantly at schools, where they have inspired quite some kids to go to university and change the world.
021116-the-app

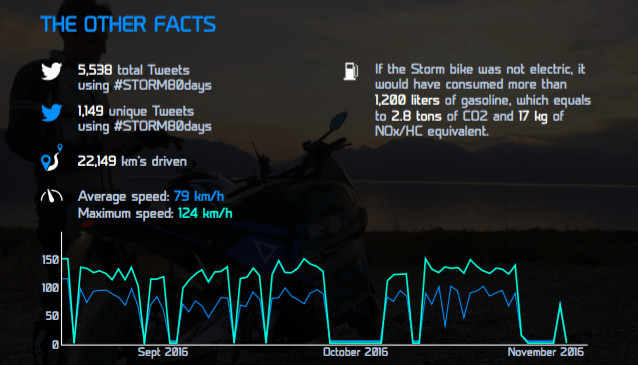
And we assembled 147 data facts on the various data sources, by a team of 12 data scientists. Which sometimes was hard, for example when the team was driving through countries with no internet or 3G hence no motor data. But luckily, there were always tweets to analyze (more than 5.000 in total during the tour), whether it would be on positive or negative sentiment, on hashtags used, or on country of origin of the tweeting persons.

An amazing journey, a true experience, and hopefully a big step towards widespread adoption of electric driving.
021116-other-facts


Like this article? Subscribe to our weekly newsletter to never miss out!

Follow @DataconomyMedia

Tags: Analyticsdata scienceItilitySTORM Wavesurveillance

Related Posts

Digital inheritance technology by Glenn Devitt addresses the $19T asset transfer problem

September 5, 2025
Earn Stable Crypto Passive Income in 2025 with 5 Best AI Crypto Coin Staking Cloud Mining Platforms

Earn Stable Crypto Passive Income in 2025 with 5 Best AI Crypto Coin Staking Cloud Mining Platforms

September 4, 2025
Why BPM tools are essential for the future of Business Process Automation

Why BPM tools are essential for the future of Business Process Automation

September 3, 2025
Top Model Context Protocol tools and platforms in 2025

Top Model Context Protocol tools and platforms in 2025

September 3, 2025
When Regulation Embraces Innovation: Xenco Medical Founder and CEO Jason Haider Discusses the Upcoming 2026 CMS Transforming Episode Accountability Model

When Regulation Embraces Innovation: Xenco Medical Founder and CEO Jason Haider Discusses the Upcoming 2026 CMS Transforming Episode Accountability Model

August 26, 2025
DeFAI and the Future of AI Agents

DeFAI and the Future of AI Agents

July 26, 2025
Please login to join discussion

LATEST NEWS

Texas Attorney General files lawsuit over the PowerSchool data breach

iPhone 17 Pro is expected to arrive with 48mp telephoto, variable aperture expected

AI chatbots spread false info in 1 of 3 responses

OpenAI to mass produce custom AI chip with Broadcom in 2025

When two Mark Zuckerbergs collide

Deepmind finds RAG limit with fixed-size embeddings

Dataconomy

COPYRIGHT © DATACONOMY MEDIA GMBH, ALL RIGHTS RESERVED.

  • About
  • Imprint
  • Contact
  • Legal & Privacy

Follow Us

  • News
    • Artificial Intelligence
    • Cybersecurity
    • DeFi & Blockchain
    • Finance
    • Gaming
    • Startups
    • Tech
  • Industry
  • Research
  • Resources
    • Articles
    • Guides
    • Case Studies
    • Glossary
    • Whitepapers
  • Newsletter
  • + More
    • Conversations
    • Events
    • About
      • About
      • Contact
      • Imprint
      • Legal & Privacy
      • Partner With Us
No Result
View All Result
Subscribe

This website uses cookies. By continuing to use this website you are giving consent to cookies being used. Visit our Privacy Policy.