As of last week, the team of STORM was in China – being treated as movie stars, with young students fighting to take a selfie with the motor and the team, and several autograph sessions.
The CAN data cannot be sent these days due to internet restrictions, and our analytics on web visits show only 28 visits from China thus far. So, instead of looking into the real-time data, let’s take this blog to dig deeper into the IT-part. What is under the hood of the website http://follow.storm-eindhoven.com and where is all data coming from?
To be able to cope with varying numbers of visitors to the site and give them steady performance, the infrastructure on which the site runs is cloud-based (servers, storage, web application).
The cloud infrastructure connects to an analytics platform via NodeJS and to the front end with AngularJS. All data is ingested, stored, queried and visualized via the Itility Managed Analytics Platform (IMAP), which is also cloud based – and set up to be flexible, highly available, and able to cope with varying usage patterns and varying data loads. The analytics platform is a combination of Azure, Splunk, Python and R.
What kind of data is loaded into this analytics platform to show the various items on the site? Let’s have a look from top to bottom of the site.
On the top of the site on the right hand side you see the data of the current stage. Stage number, destination, planned departure: all loaded from this part of the STORM website: https://www.storm-eindhoven.com/World_Tour_2016/schedule/day-40-september-23-2016
“Motor connected” means that the GPS tracker in the motor is activated. This GPS tracker sends real-time data on position to the analytics platform, and enables the blue bike picture to be “driving” along the distance line.
Your time (the time zone that you are in) and Bike time (the local time zone of where the bike is) is shown via the Google-API.

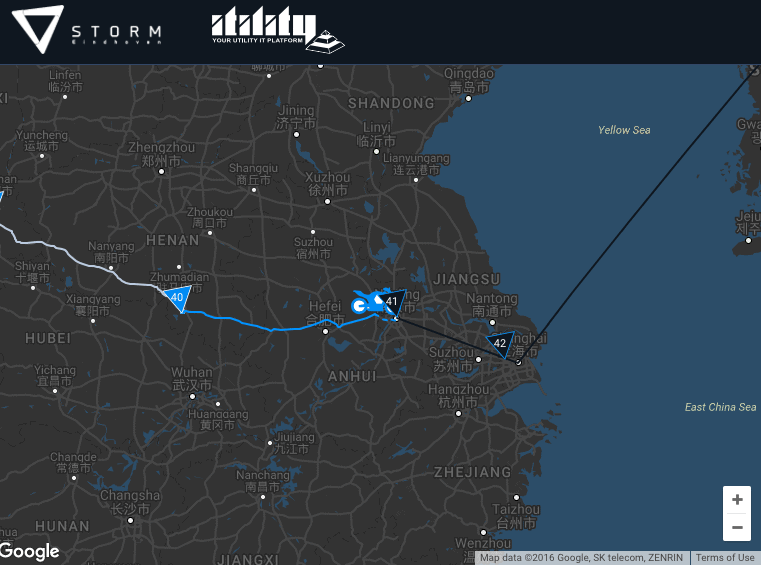
The GPS data and the Google-API are also used in the left top part of the site – the map that shows the stages that the bike is riding, with a white line for the stages already driven, a blue line for the current stage, and a black line for upcoming stages.
Seeing the bike “driving” on that map is made possible via a combination of Google Maps, the same above link to the website of STORM where all stages with starting point and end point are administered, and a translation table that translates all those destinations in a longitude and latitude. This of course combined with the GPS tracker in the motor that tells where the bike is driving.
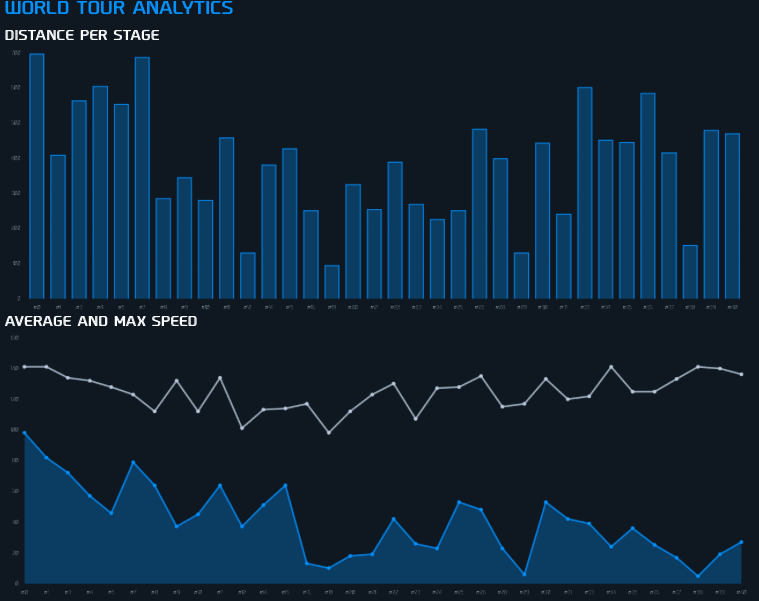
This data is also used for the daily graphs that show distance and max and average speed.
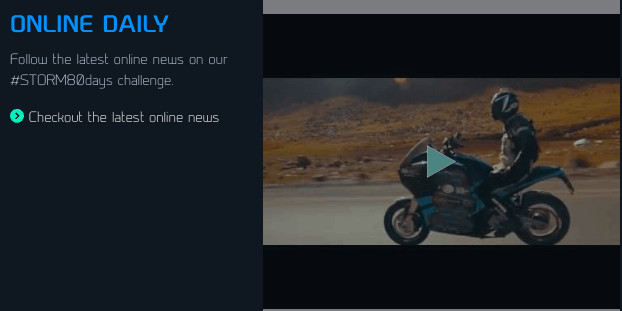
The next part of the website shows several other embedded data sources, such as http://paper.li/e-1470149528, where all news items regarding STORM are collected, and where there is a link to the STORM YouTube channel via an API.
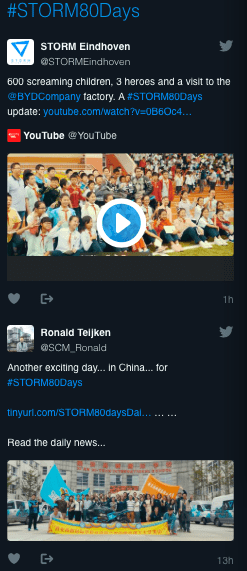
A twitter feed makes it possible to show the 3 most current tweets that are mentioning #STORM80Days. All twitter data is also loaded into the Analytics platform to enable analysis on tweets such as sentiment analysis, word co-occurrence, word clouds on used hashtags, and the correlation between tweets and site visits.
The last part of the website, in the middle, comprises the data analysis facts. These facts are created in the Analytics platform and automatically loaded onto the site via a live lookup table feed. This table includes start time and end time per fact, and the direct feed ensures that a fact appears at the exact time that is noted in the field “start time” and is removed from the site at the exact time that is noted in the field “end time”. Normal date notation might cause confusion due to all different time zones, hence those times are noted in Epoch time.
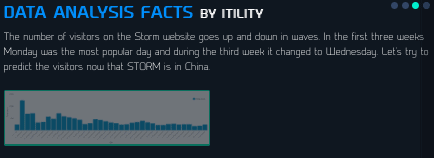
Creating the facts is manual work. Our team of data scientists analyzes the various data sources that we load into the Itility Managed Analytics Platform on a daily basis: GPS data from the tour, CAN data from the bike components, weather data from the Weather Company, Twitter data, Google Analytics on site visits.
Would you like to see a certain analysis or fact? Please let us know (via IMAP@Itility.nl) and we will start crunching!
Like this article? Subscribe to our weekly newsletter to never miss out!


