Dataconomy
  • News
    • Artificial Intelligence
    • Cybersecurity
    • DeFi & Blockchain
    • Finance
    • Gaming
    • Startups
    • Tech
  • Industry
  • Research
  • Resources
    • Articles
    • Guides
    • Case Studies
    • Glossary
    • Whitepapers
  • Newsletter
  • + More
    • Conversations
    • Events
    • About
      • About
      • Contact
      • Imprint
      • Legal & Privacy
      • Partner With Us
Subscribe
No Result
View All Result
  • AI
  • Tech
  • Cybersecurity
  • Finance
  • DeFi & Blockchain
  • Startups
  • Gaming
Dataconomy
  • News
    • Artificial Intelligence
    • Cybersecurity
    • DeFi & Blockchain
    • Finance
    • Gaming
    • Startups
    • Tech
  • Industry
  • Research
  • Resources
    • Articles
    • Guides
    • Case Studies
    • Glossary
    • Whitepapers
  • Newsletter
  • + More
    • Conversations
    • Events
    • About
      • About
      • Contact
      • Imprint
      • Legal & Privacy
      • Partner With Us
Subscribe
No Result
View All Result
Dataconomy
No Result
View All Result

Google in Real Time

byEileen McNulty
July 26, 2014
in News

Google in Real Time
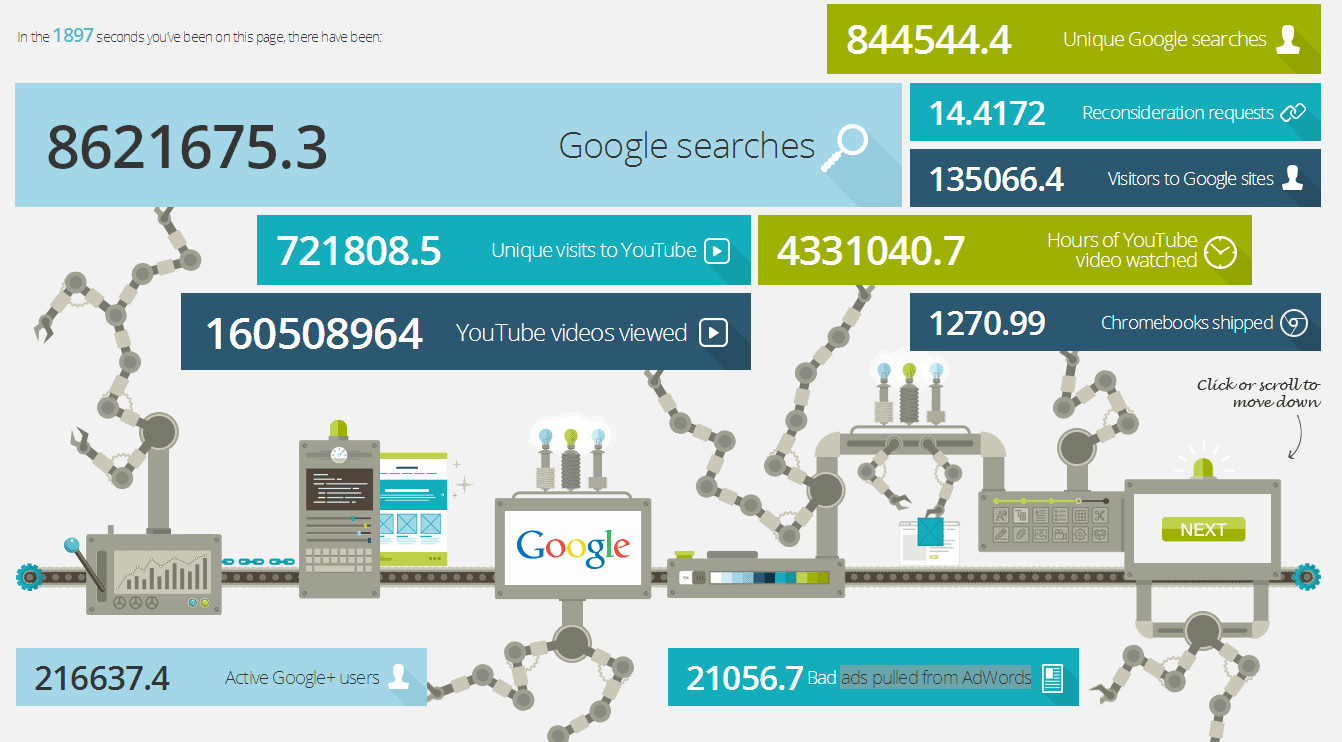
If you ever need a quick statistic on how rapidly data grows, I refer you to this real-time visualisation. It offers a panoramic view of Google in real time. As well as obvious stats like the amount of searches committed and the amount of data received, it also had stats on the the amount of bad ads pulled from AdWords per second and the amount Google spends on lobbying and R&D.

We left the website open for a couple of minutes (1703 seconds, to be precise). During this time, Google spent $459230.98 on research and development, made $3391354.2 in revenue, and saw 194482.6 active users on its Google+ site (we were surprised by that last one too). Check out the visualisation here.

Stay Ahead of the Curve!

Don't miss out on the latest insights, trends, and analysis in the world of data, technology, and startups. Subscribe to our newsletter and get exclusive content delivered straight to your inbox.

Tags: Visualisations

Related Posts

Waterfall 2.0: AI brings back structured software development

Waterfall 2.0: AI brings back structured software development

November 14, 2025
Chinese hackers use Claude to run large scale cyberespionage

Chinese hackers use Claude to run large scale cyberespionage

November 14, 2025
Google expands Pixel call recording to global users

Google expands Pixel call recording to global users

November 14, 2025
Facebook levels up Marketplace with social features and AI support

Facebook levels up Marketplace with social features and AI support

November 14, 2025
NotebookLM gains automated research and wider file support

NotebookLM gains automated research and wider file support

November 14, 2025
Tesla is reportedly testing Apple CarPlay integration

Tesla is reportedly testing Apple CarPlay integration

November 14, 2025
Please login to join discussion

LATEST NEWS

Waterfall 2.0: AI brings back structured software development

Chinese hackers use Claude to run large scale cyberespionage

Google expands Pixel call recording to global users

Facebook levels up Marketplace with social features and AI support

NotebookLM gains automated research and wider file support

Tesla is reportedly testing Apple CarPlay integration

Dataconomy

COPYRIGHT © DATACONOMY MEDIA GMBH, ALL RIGHTS RESERVED.

  • About
  • Imprint
  • Contact
  • Legal & Privacy

Follow Us

  • News
    • Artificial Intelligence
    • Cybersecurity
    • DeFi & Blockchain
    • Finance
    • Gaming
    • Startups
    • Tech
  • Industry
  • Research
  • Resources
    • Articles
    • Guides
    • Case Studies
    • Glossary
    • Whitepapers
  • Newsletter
  • + More
    • Conversations
    • Events
    • About
      • About
      • Contact
      • Imprint
      • Legal & Privacy
      • Partner With Us
No Result
View All Result
Subscribe

This website uses cookies. By continuing to use this website you are giving consent to cookies being used. Visit our Privacy Policy.