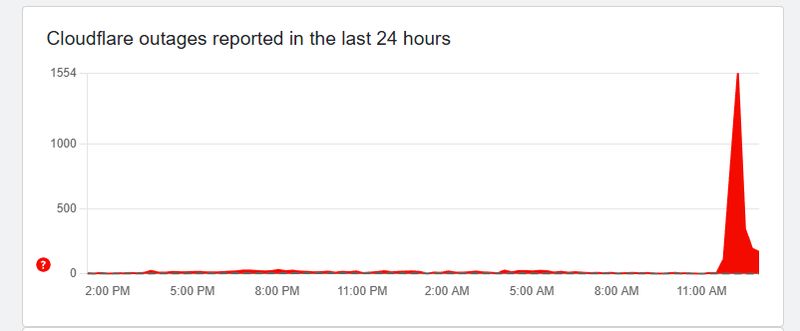
Just weeks after the last major incident, IT admins and internet users are waking up to another wave of connectivity headaches. Cloudflare is down again, but this time the symptoms—and the error messages—are slightly different.
Update: Downdetector and Cloudflare’s status pages are back online, yet access problems persist for Canva and a wide range of sites running on Cloudflare’s infrastructure.

Is Cloudflare down: “500 Internal Server Error”
History has a funny way of repeating itself. Once again, users attempting to check Downdetector to see if the internet is broken are hitting a wall.
Instead of the standard “Is it down?” charts, visitors are seeing a stark, white screen displaying a “500 Internal Server Error” with the Cloudflare branding at the bottom.

What this tells us: A 500 error generally means “something went wrong on the server’s end.” While Cloudflare says their CDN (the part that loads web pages) is fine, the fact that a major site like Downdetector is throwing this specific error suggests the impact might be more complex than just a “Dashboard” problem.

Official status: The “dashboard” outage
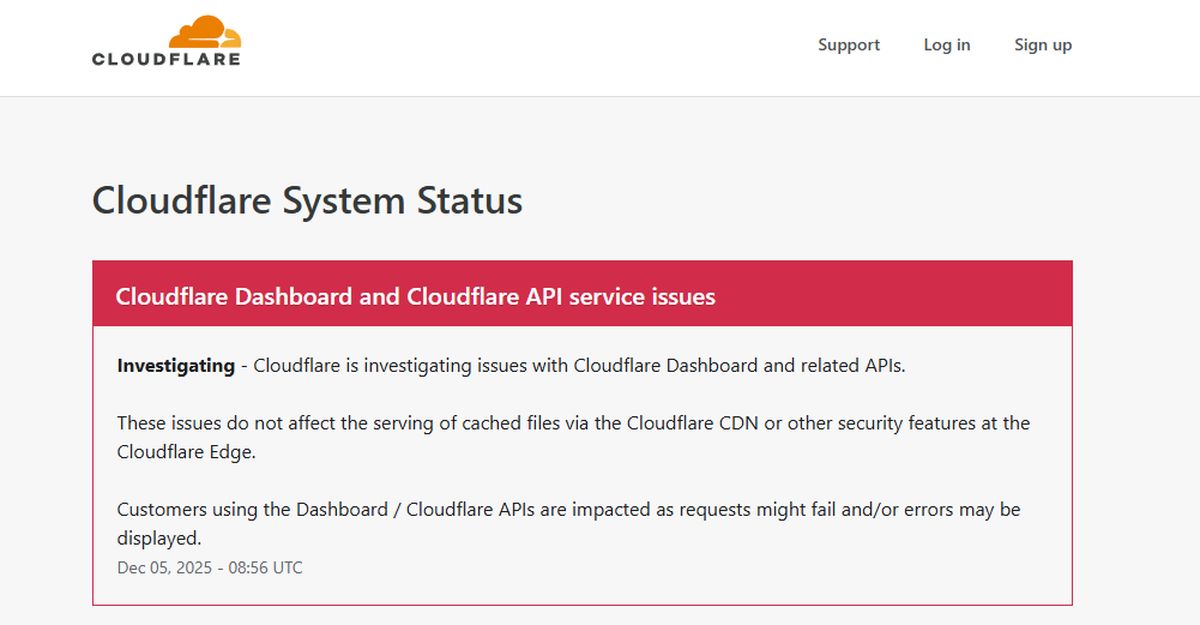
According to the Cloudflare System Status page, the company officially acknowledged the incident at 08:56 UTC.
The specific issue:
Cloudflare Dashboard and Cloudflare API service issues Investigating – Cloudflare is investigating issues with Cloudflare Dashboard and related APIs.
The Silver Lining (Maybe): Cloudflare explicitly states:
“These issues do not affect the serving of cached files via the Cloudflare CDN or other security features at the Cloudflare Edge.”
Translation: If you are just browsing a static news site, it should work. But if you are a developer trying to log in to change a setting, or if you use an app that relies on Cloudflare’s API to fetch live data, you are currently out of luck.
Is Chicago to blame? (ORD maintenance)
Just like the previous outage, there is a backdrop of scheduled maintenance.
Location: ORD (Chicago) Datacenter
Time: Dec 5, 2025, 07:00 – 11:00 UTC
Status: “In progress”
While maintenance in one city shouldn’t theoretically break the global Dashboard, the timing (maintenance starting at 07:00 UTC and issues spiking shortly after) is a coincidence that many network engineers are eyeing suspiciously.
Cloudflare admits a bot filter bug caused its worst outage since 2019
What this means for you
If you manage a website: You likely cannot log in to your Cloudflare dashboard right now. Do not panic if you can’t clear your cache or add a new DNS record—the control panel is effectively frozen until they fix the API.
If you see 500 Errors: This indicates a failure in the “handshake” between the site’s server and Cloudflare. It is not your internet connection.
Wait it Out: Since the “Edge” (the part that serves content) is reportedly stable, most standard web browsing should remain functional. The pain today is mostly felt by developers, IT admins, and complex web apps.
We will continue to monitor the situation and update as the status changes from “Investigating” to “Resolved.”


