Dataconomy
  • News
  • AI
  • Big Data
  • Machine Learning
  • Trends
    • Blockchain
    • Cybersecurity
    • FinTech
    • Gaming
    • Internet of Things
    • Startups
    • Whitepapers
  • Industry
    • Energy & Environment
    • Finance
    • Healthcare
    • Industrial Goods & Services
    • Marketing & Sales
    • Retail & Consumer
    • Technology & IT
    • Transportation & Logistics
  • Events
  • About
    • About Us
    • Contact
    • Imprint
    • Legal & Privacy
    • Newsletter
    • Partner With Us
    • Writers wanted
Subscribe
No Result
View All Result
Dataconomy
No Result
View All Result

Graph Visualization with a Time Machine

by Dr. Jans Aasman
August 29, 2017
in BI & Analytics, Data Science, News
Home Topics Data Science BI & Analytics
Share on FacebookShare on TwitterShare on LinkedInShare on WhatsAppShare on e-mail

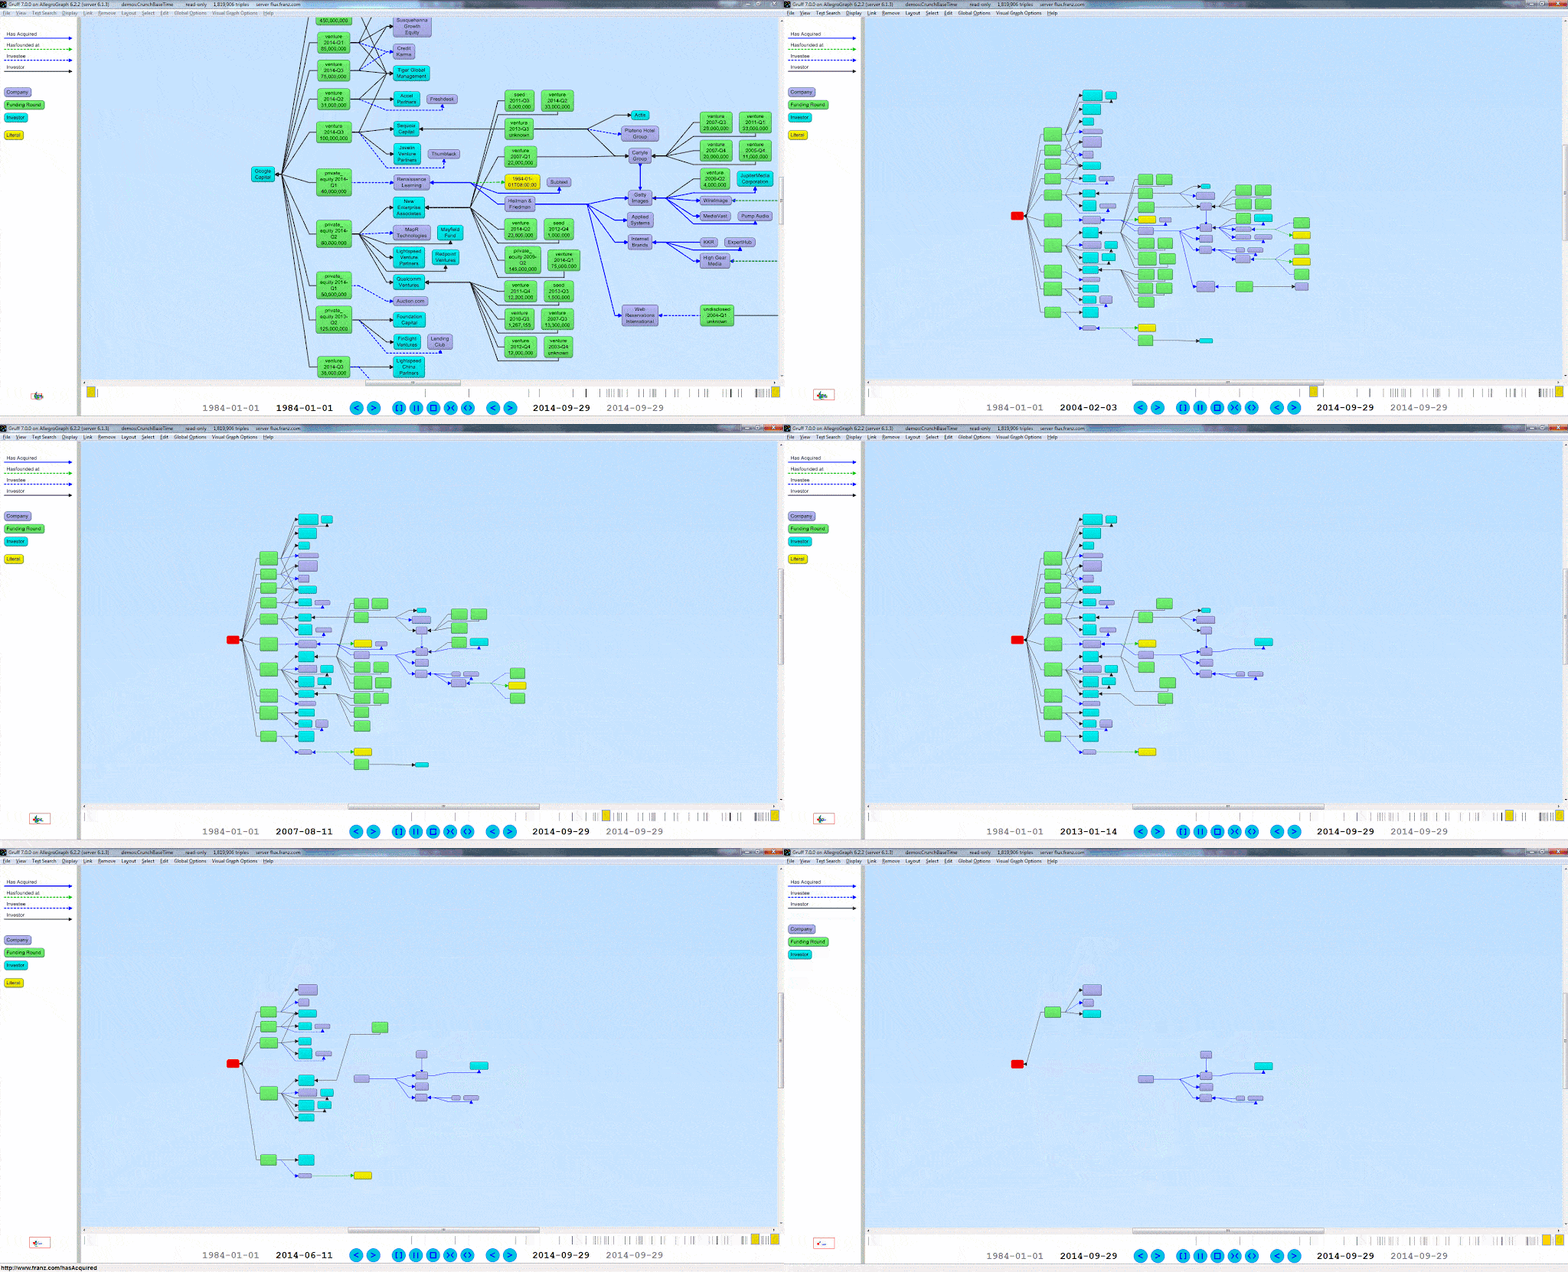
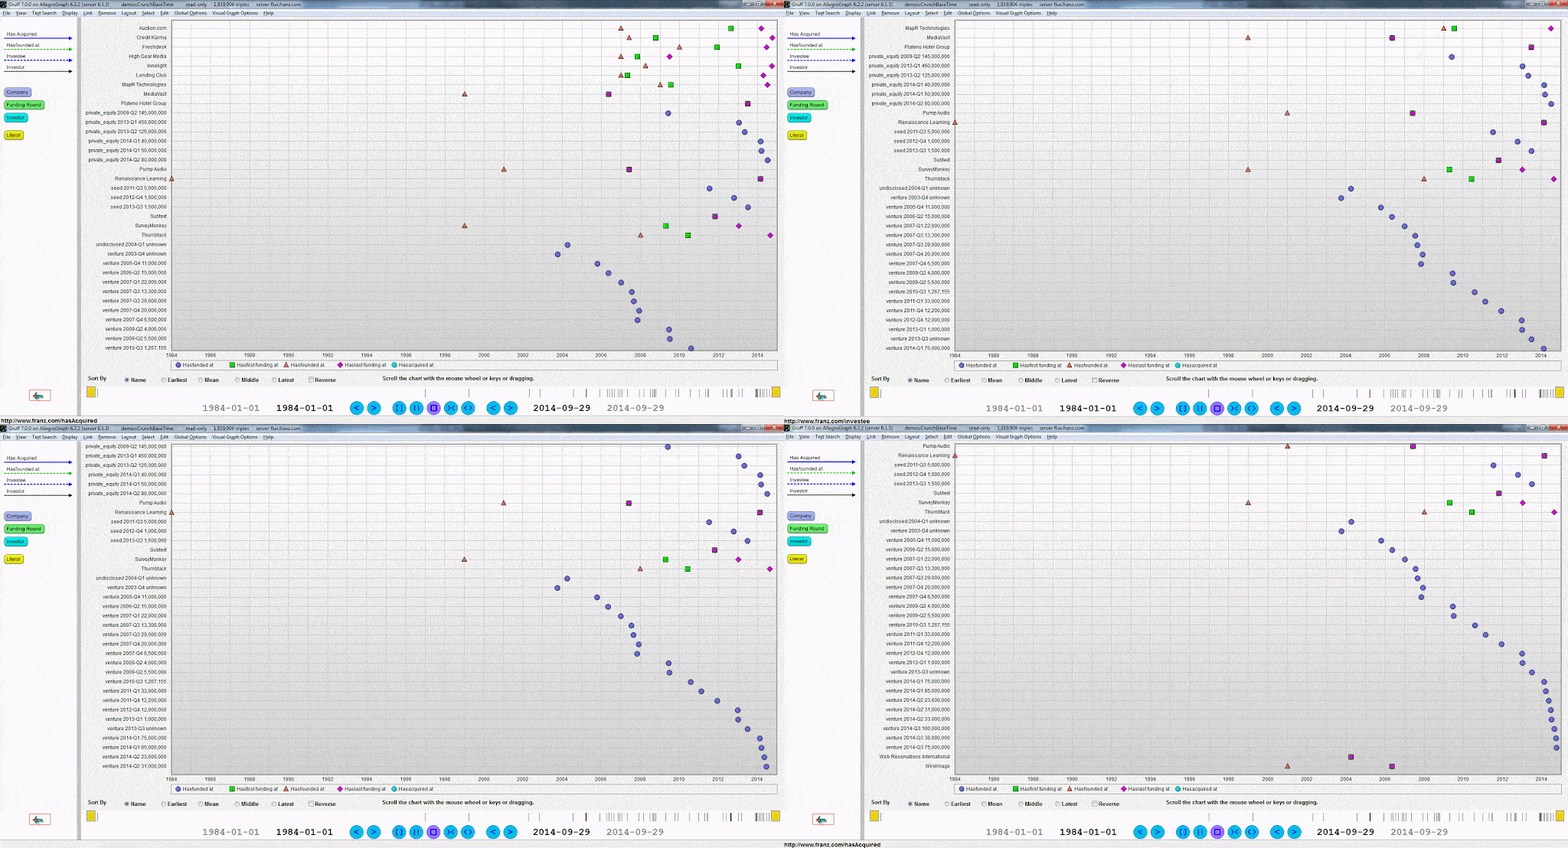
Franz Inc., an early innovator in Artificial Intelligence (AI) and leading supplier of Semantic Graph Database technology for Knowledge Graphs, recently announced Gruff v7.0, the industry’s leading Graph Visualization software for exploring and discovering connections within data. Gruff provides novice users and graph experts the ability to visually build queries and explore connections as they developed over time. The new time slider feature speeds discovery and enhances the ability to uncover hidden relationships within time based data.

When asked about the new ‘Time Machine’ feature, Franz Inc., CEO Dr. Jans Aasman said that it “provides the user with an important capability to explore temporal connections in their data. They can see how relationships are created over time and are able to replay the evolving graph for new temporal based insights.”

According to the news release, Gruff v7.0 produces dynamic data visualizations that organize connections between data in views that are driven by the user. This visual flexibility can instantly unveil new discoveries and knowledge that turn complex data into actionable business insights.
Graph Visualization with a Time Machine

Gruff was developed by Franz to address Graph Search in large data sets and empower users to intelligently explore graphs in multiple views including:


Join the Partisia Blockchain Hackathon, design the future, gain new skills, and win!


Graphical View with new “Time Machine” feature – See the shape and density of graph data evolve over time.

●      Tabular view – Understand objects as a whole

●      Outline view – Explore the often hierarchical nature of graphs

●      Query view – Write Prolog or SPARQL queries

●      Graphical Query Builder – Create queries visually via drag and drop
Graph Visualization with a Time Machine

At Intel’s recent launch event for Xeon Scalable Processors,  Gruff and AllegroGraph were featured as part of the Semantic Data Lake for Healthcare.  A collaboration with Franz Inc., Montefiore Medical Center (the eighth largest hospital in the U.S.), and Intel to provide a scalable and extensible Healthcare platform designed for Accountable Care and Personalized Medicine initiatives.

“Making sense out of big data is a challenge, particularly in the healthcare industry where information comes from a variety of sources and in different forms including structured, unstructured, images, temporal, geo-location and signal data,” said Dr. Aasman, “With Gruff as part of the Semantic Data Lake platform, we can perform visual data exploration to discover new relationships between data that can save lives and improve care.”

Franz was recently recognized by Database Trends and Applications as one of “The Companies That Matter Most in Data”, due in part to the unique discovery capabilities offered by the combination of Gruff and AllegroGraph, Franz’s Graph Database technology. It enables businesses to extract sophisticated decision insights and predictive analytics from highly complex, distributed data that cannot be uncovered with conventional databases. AllegroGraph is utilized by dozens of the top Fortune 500 companies worldwide.

Bloor Research recently positioned AllegroGraph as a “Champion” and highest ranked product in its class.  “AllegroGraph is the highest ranked product in its class, and, thanks to Gruff, it was rated as the easiest product to use.” – Bloor Research

Gruff 7.0 is available for free

Gruff is available as a free download from the AllegroGraph website. The product runs on Mac OSX, Windows, Linux and is offered as a standalone application or client-server for remote users.

Franz Inc. recently hosted a webinar in which they demonstrated the power of Gruff’s new ‘Time Machine’ feature. It explored the temporal aspects of events using a set of practical examples from healthcare, government intelligence, the world of finance, and real estate. Take a look at the Webcast.


Like this article? Subscribe to our weekly newsletter to never miss out!

Follow @DataconomyMedia

Tags: AllegroGraphDatabase TechnologyFranz Inc.Graph VisualizationGruff 7.0

Related Posts

How did ChatGPT passed an MBA exam

How did ChatGPT passed an MBA exam?

January 27, 2023
What is AI prompt engineering? Learn how to write a prompt with examples. ChatGPT prompt engineering and more explained in this article.

AI prompt engineering is the key to limitless worlds

January 27, 2023
What is Analytics as a Service (AaaS): Examples

Transform your data into a competitive advantage with AaaS

January 26, 2023
Google code red: ChatGPT and You.com like AI-powered tools threatening the search engine. Moreover, latest Apple Search rumors increased the danger.

Google code red: ChatGPT, You.com and rumors of Apple Search challenge the dominance of search giant

January 26, 2023
Tome AI offers a new way to create presentations easily

Tome AI offers a new way to create presentations easily

January 25, 2023
Top 4 business intelligence reporting tools       

Transforming data into insightful information with BI reporting

January 25, 2023

Leave a Reply Cancel reply

Your email address will not be published. Required fields are marked *

LATEST ARTICLES

How did ChatGPT passed an MBA exam?

AI prompt engineering is the key to limitless worlds

Transform your data into a competitive advantage with AaaS

Google code red: ChatGPT, You.com and rumors of Apple Search challenge the dominance of search giant

Tome AI offers a new way to create presentations easily

Transforming data into insightful information with BI reporting

Dataconomy

COPYRIGHT © DATACONOMY MEDIA GMBH, ALL RIGHTS RESERVED.

  • About
  • Imprint
  • Contact
  • Legal & Privacy
  • Partnership
  • Writers wanted

Follow Us

  • News
  • AI
  • Big Data
  • Machine Learning
  • Trends
    • Blockchain
    • Cybersecurity
    • FinTech
    • Gaming
    • Internet of Things
    • Startups
    • Whitepapers
  • Industry
    • Energy & Environment
    • Finance
    • Healthcare
    • Industrial Goods & Services
    • Marketing & Sales
    • Retail & Consumer
    • Technology & IT
    • Transportation & Logistics
  • Events
  • About
    • About Us
    • Contact
    • Imprint
    • Legal & Privacy
    • Newsletter
    • Partner With Us
    • Writers wanted
No Result
View All Result
Subscribe

This website uses cookies. By continuing to use this website you are giving consent to cookies being used. Visit our Privacy Policy.