As of October 4th, the STORM team is traveling the US, with exciting events such as a visit to Tesla and Google, driving on the Golden Gate bridge – and a hackathon on the STORM data at Stanford University.
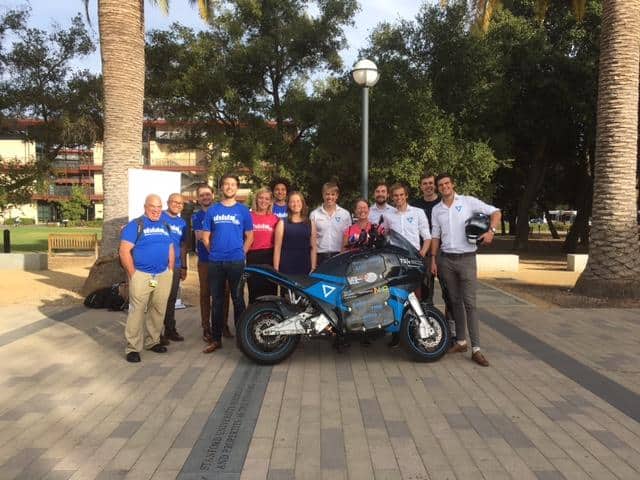
What was the hackathon about? A simple task: let’s crunch some data and see if we can help the STORM team!
The hackathon started (after taking pictures of the bike) with a short presentation by STORM on their tour, how the bike was set up and where they had been driving.
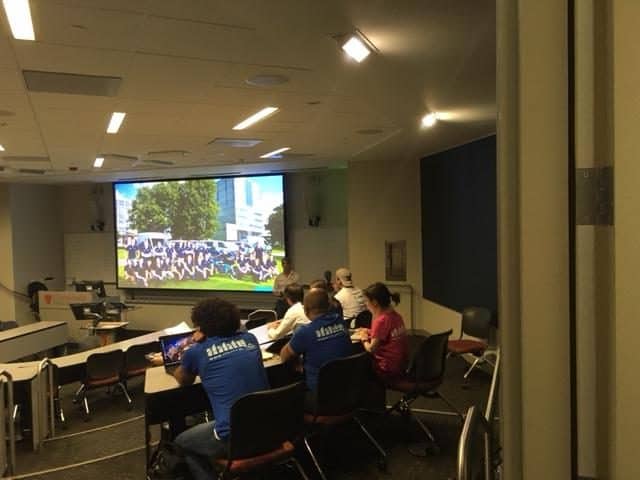
Next step: Explaining the data. There was a lot of data available, so each team could go their own way. So far, we gathered 28 days of data from the bike. This was a stunning total of 150 million events, which could be anything from a battery error or a temperature measurement, to the left blinker being turned on.
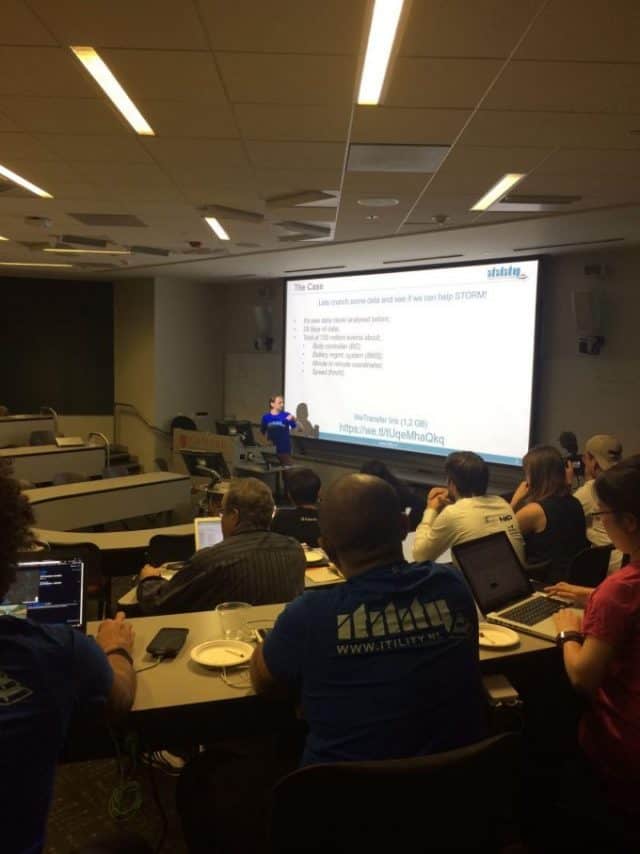
The data came from 3 main sources:
- The battery management system (BMS), containing a lot of detailed data from the bike’s complex battery system
- The body controller (BC), containing all sorts of data from the controls of the bike (from horn to cruise-control)
- The built-in 3G/GPS module, which sends real-time GPS coordinates and speed of the bike.
Data cleaning
Raw logs generated by the bike are formatted as hexadecimal byte arrays. While this makes the logging very efficient in terms of size, interpreting them is less easy. So in the days before the hackathon we pre-processed all internal logging of the bike, and cleaned it as well, to get the teams up and running as quick as possible. It took the teams some time to get used to the data, but luckily the whole STORM team was present to answer all kinds of questions.
Results
After two hours, each team was called forward to give a 2-minute pitch about what they were working on, and their interesting findings so far. It was immediately clear that most groups focused on the battery system, which was to be expected.
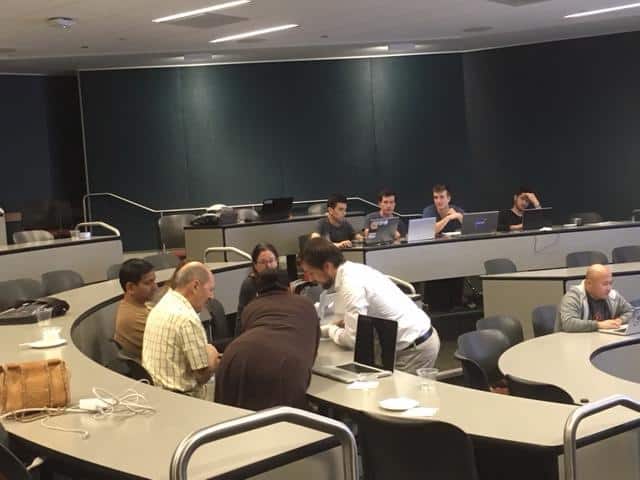
The first group (“The Electricians”, bottom left of the photo) noticed some spiking in the current of some battery cells. They were trying to figure out whether this could lead to overall efficiency-loss of the batteries, since they are all linked together. The team focused on battery anomalies, tracking battery spikes per cartridge and total set. Next step: evaluate spikes and correlation with temperature and terrain.
Similarly, one group (“The 4 guys”, top right of the photo) found consistent temperature differences between cells, and related this to their position in the bike. Knowing that batteries become less efficient with increasing temperatures, they looked into optimizing battery placement to increase efficiency.
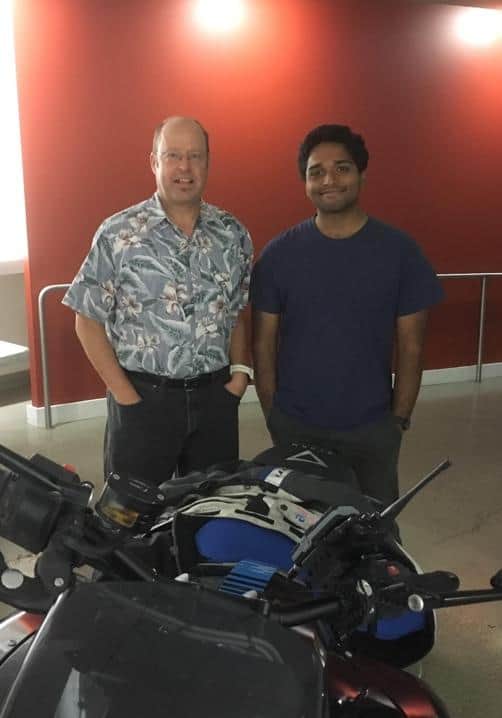
Not all groups jumped on the battery data: the winning group (Robert and Shreyas, photo below) related the information from the Body Controller (front brake, rear brake, blinker) and tried to find out in what kind of environment the bike was driving based on the way it was handled and logged. For example, a lot of braking and active blinkers could point to an urban environment, while when the brakes and blinker were rarely used it would be likely that the motorcycle is driving on the highway.
Once knowing the environment the motorcycle is driving in, the team will use that information to determine battery- and motor-efficiency, to determine how the environment effects all the other motorcycle CAN data.
Another team (“The Chinese Ladies”, photo below) focused on the correlation between speed and temperature and did a high current/low voltage analysis, plotting the current by cartridge per position. They also created a nice moving map showing speed & location on a map.
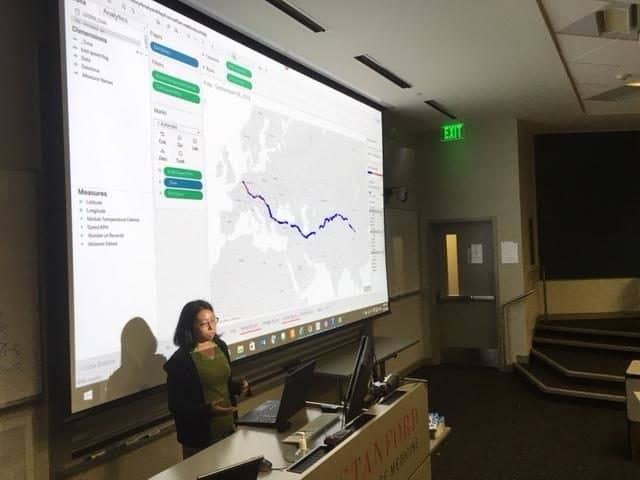
Speed data was also used by team “Chinese Boy and Girl” who plotted speed per day to define a correlation between speed and temperature, and temperature and battery. So did team “Pink Jing-solo” who created a model to predict the impact of temperature and location on speed.
The next hackathon on the same data set will be in the Netherlands. Check it out here.
Like this article? Subscribe to our weekly newsletter to never miss out!


