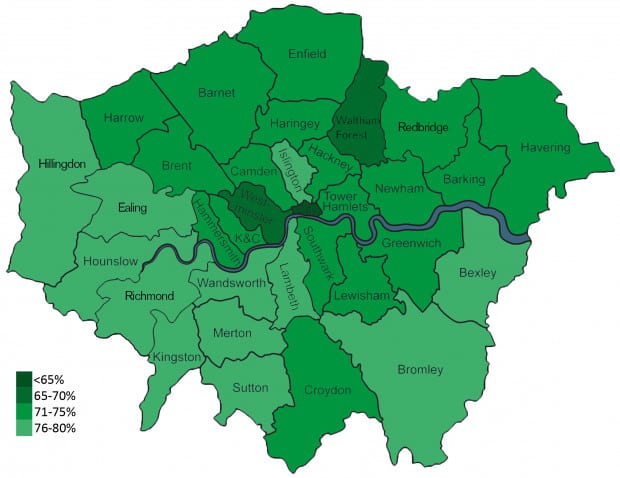
New research from PlaceILive.com, the Yelp for Neighborhoods, has visualized where in London most businesses make it through their crucial first two years. Using open data, which they use to calculate their signature Life Quality Index, they ranked London’s boroughs according to the 2-year business survival rates.
 Two year business survival rates in London. Source: Office of National Statistics
The best boroughs to start a new business are Sutton and Kingston Upon Thames, where as the City of London is the most risky area to start one. In the top two boroughs 79% of new businesses make it through their first two years where as the lowest score is a mere 64%. The full list of business survival rates can be found at the bottom.
PlaceILive conducted this research to show how its platform helps entrepreneurs, startups and commercial real estate in London. By providing a combination of government open data and user reviews the startup measures livability of cities, which is both a useful tool for residents as for up coming businesses when deciding where to settle.
When trying to find an explanation of why new businesses are more likely to survive their first few years, PlaceILive found the strongest correlation with the transport accessibility scores from Transport for London. Surpassing the more likely suspects as income, vandalism, crime, or unemployment.
Their research has shown a significant negative correlation between the 2-year business survival rates and transport accessibility scores. The less accessible transport, the more likely businesses were to survive their initial two years. As the numbers from the Office of National Statistics includes all sorts of businesses (ranging from tech startups, freelance photographers to clothing stores, supermarkets and take away restaurants) one of the possible implications of this research could be that consumers prefer to shop nearby whenever a far away competitor is too difficult to visit.
No matter if this implication holds up, it is valuable to see that businesses outside of the city center tend to be less risky than those in the city. Regardless of what the causation is for these business survival rates, it does help entrepreneurs calculate the financial risks they are taking and tells consumers to appreciate the smaller businesses in the city, as they might not be there for too long.
Two-year Business Survival Rates for London Boroughs:
| City of London | 64 |
| Westminster | 69 |
| Waltham Forest | 69 |
| Southwark | 71 |
| Newham | 71 |
| Enfield | 71 |
| Camden | 71 |
| Barnet | 72 |
| Lewisham | 73 |
| Hammersmith and Fulham | 73 |
| Greenwich | 73 |
| Barking and Dagenham | 73 |
| Kensington and Chelsea | 74 |
| Haringey | 74 |
| Brent | 74 |
| Tower Hamlets | 75 |
| Redbridge | 75 |
| Havering | 75 |
| Harrow | 75 |
| Hackney | 75 |
| Croydon | 75 |
| Lambeth | 76 |
| Islington | 76 |
| Hounslow | 76 |
| Merton | 77 |
| Hillingdon | 77 |
| Ealing | 77 |
| Bromley | 77 |
| Bexley | 77 |
| Wandsworth | 78 |
| Richmond upon Thames | 78 |
| Sutton | 79 |
| Kingston upon Thames | 79 |
Featured image credit: Death to the Stock Photo


