Dataconomy
  • News
    • Artificial Intelligence
    • Cybersecurity
    • DeFi & Blockchain
    • Finance
    • Gaming
    • Startups
    • Tech
  • Industry
  • Research
  • Resources
    • Articles
    • Guides
    • Case Studies
    • Glossary
    • Whitepapers
  • Newsletter
  • + More
    • Conversations
    • Events
    • About
      • About
      • Contact
      • Imprint
      • Legal & Privacy
      • Partner With Us
Subscribe
No Result
View All Result
  • AI
  • Tech
  • Cybersecurity
  • Finance
  • DeFi & Blockchain
  • Startups
  • Gaming
Dataconomy
  • News
    • Artificial Intelligence
    • Cybersecurity
    • DeFi & Blockchain
    • Finance
    • Gaming
    • Startups
    • Tech
  • Industry
  • Research
  • Resources
    • Articles
    • Guides
    • Case Studies
    • Glossary
    • Whitepapers
  • Newsletter
  • + More
    • Conversations
    • Events
    • About
      • About
      • Contact
      • Imprint
      • Legal & Privacy
      • Partner With Us
Subscribe
No Result
View All Result
Dataconomy
No Result
View All Result

Infographic: The US’ Top Secret Intelligence Budget, Visually Simplified

byEileen McNulty
June 21, 2014
in infographics
Home Resources infographics

Infographic The US' Top Secret Intelligence Budget, Visually Simplified

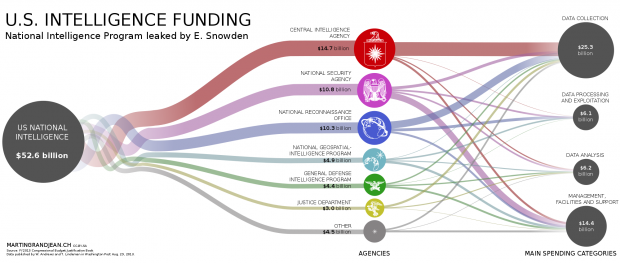
Last year, the Washington Post released a detailed look into the data leaked by Edward Snowden concerning US intelligence funding. Martin Grandjean used this data to create one simple, overarching graphic, detailing the spending of various intelligence agencies within the US.

For the visualisation, Grandjean used Gephi software, and worked on it in Inkscape. The visualisation shows how the immense $52.6 billion was distributed amongst the US intelligence community, with five main agencies making up the bulk of the spending: CIA (28%), NSA (21%), NRO (20%), NGP (9%) and GDIP (8%).

Stay Ahead of the Curve!

Don't miss out on the latest insights, trends, and analysis in the world of data, technology, and startups. Subscribe to our newsletter and get exclusive content delivered straight to your inbox.

For more information, please see Grandjean’s original post about the graphic.
Tags: infographicintelligenceVisualisation

Related Posts

Here are the biggest challenges SMEs in the UK are facing

Here are the biggest challenges SMEs in the UK are facing

February 19, 2020
How Is Data Affecting Your Dating Life?

How Is Data Affecting Your Dating Life?

July 10, 2019
AI Jobs Disruption – Why the U.S. Financial Services Industry is Different

AI Jobs Disruption – Why the U.S. Financial Services Industry is Different

April 24, 2019
Snapshot: Data Scientist Salaries and Jobs in Europe

Snapshot: Data Scientist Salaries and Jobs in Europe

January 24, 2019
What is driving Europe’s tech economy?

What is driving Europe’s tech economy?

January 17, 2019
INFOGRAPHIC: How Netflix Uses Big Data to Drive Success

INFOGRAPHIC: How Netflix Uses Big Data to Drive Success

March 13, 2018
Please login to join discussion

LATEST NEWS

Zoom announces AI Companion 3.0 at Zoomtopia

Google Cloud adds Lovable and Windsurf as AI coding customers

Radware tricks ChatGPT’s Deep Research into Gmail data leak

Elon Musk’s xAI chatbot Grok exposed hundreds of thousands of private user conversations

Roblox game Steal a Brainrot removes AI-generated character, sparking fan backlash and a debate over copyright

DeepSeek releases R1 model trained for $294,000 on 512 H800 GPUs

Dataconomy

COPYRIGHT © DATACONOMY MEDIA GMBH, ALL RIGHTS RESERVED.

  • About
  • Imprint
  • Contact
  • Legal & Privacy

Follow Us

  • News
    • Artificial Intelligence
    • Cybersecurity
    • DeFi & Blockchain
    • Finance
    • Gaming
    • Startups
    • Tech
  • Industry
  • Research
  • Resources
    • Articles
    • Guides
    • Case Studies
    • Glossary
    • Whitepapers
  • Newsletter
  • + More
    • Conversations
    • Events
    • About
      • About
      • Contact
      • Imprint
      • Legal & Privacy
      • Partner With Us
No Result
View All Result
Subscribe

This website uses cookies. By continuing to use this website you are giving consent to cookies being used. Visit our Privacy Policy.